
Mean and standard deviation are often calculated and used to describe a data set, possibly to compare it to another data set. However, it helps to know the key differences between these two measures.
So, what is the difference between mean and standard deviation? Mean gives the average (center) of a data set and standard deviation tells you about the spread (dispersion) of values around the mean. We use squaring to find standard deviation, but not to find the mean. Adding the same value to all data points changes the mean, but not the standard deviation.
Despite their differences, mean and standard deviation are still closely connected. In fact, we need to calculate the mean of a data set before we can find the standard deviation.
In this article, we’ll talk about the differences between mean and standard deviation of a data set. We’ll also look at some examples to make the concepts clear.
Let’s get started.
What Is The Difference Between Mean & Standard Deviation?
Mean and standard deviation are both descriptive statistics, but there are several important differences between mean and standard deviation:
- Describing A Data Set: Mean tells you about the center (average) of a data set, while standard deviation tells you about the spread (dispersion or variability) or a data set.
- Calculating Statistics For A Data Set: We do not use squaring to calculate the mean, but we do use squaring to calculate standard deviation.
- Changes To Values In A Data Set: Mean is affected by addition of the same value to all data points, but standard deviation is not affected by addition of the same value to all data points.
You can learn more about what mean tells you about data (along with lots of examples) here.
Let’s take a closer look at each of these differences, starting with how these two measures describe a data set.
Describing A Data Set: Mean Vs. Standard Deviation
In simple terms, the mean of a data set tells us what to expect in the average case, while the standard deviation tells us how much things can vary from this average case.
The larger the standard deviation, the more variation we can expect in the data set. In the extreme case when standard deviation is zero, we have a data set where all points share the same value (and the mean is equal to this shared value).
If we want to compare two or more data sets:
- the mean tells us which data set is higher/lower (or better/worse) in the average case
- the standard deviation tells us which data set has a larger spread (higher standard deviation means data is more spread out from the mean)
Let’s look at some examples to clear things up a bit.
Example 1: Dividend Yield For A Stock
Let’s say that a company stock pays a dividend to shareholders each year. The amount of the dividend varies, but it is always a percentage of the value of the stock according to the formula:
- dividend yield = (dividend amount) / (stock price)
For example, a stock worth $100 that pays a $3 annual dividend has a dividend yield of:
- dividend yield = $3 / $100
or 3% annually.
If the company pays an average 4% dividend yield, but the standard deviation is 2%, then the dividend can vary quite a bit (possibly from 0% up to 8% or more, depending on the year and the company’s performance).

Example 2: Comparing Dividend Yield For Two Stocks
Let’s say we are considering an investment in one of two companies:
- Company A has paid a dividend over the past 10 years with a mean of 4% and a standard deviation of 1%.
- Company B has paid a dividend over the past 10 years with a mean of 4% and a standard deviation of 2%.
This tells us that in the average case, both companies pay the same dividend (since the mean dividend is 4% for both companies over the last 10 years).
However, in a given year, there is more variability in the dividend yield from Company B, since it has a higher standard deviation (2% for Company B vs. 1% for Company A).
If you want less volatility in your returns in the long term, you might want to choose Company A over Company B.
If you want a chance at getting a higher dividend yield in the short term, you might want to choose Company B (however, this also comes with more risk of getting a lower dividend yield in the short term).
Calculating Statistics For A Data Set: Mean Vs. Standard Deviation
When calculating the mean of a data set, we do not use squaring at all. We simply add up all of the values in the data set and then divide by the number of data points in the set.
The formula for the mean is:
- Mean = (sum of all data values) / (number of data values)
However, we do use squaring when we calculate standard deviation. In particular, we take the square of the difference between each data point and the mean.
The formula for standard deviation is:
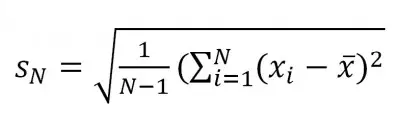
Making Changes To Values In A Data Set: Mean Vs. Standard Deviation
The mean and standard deviation “react” differently when we add the same value to every point in the data set. If we add the value “K” to every value in a data set:
- The mean increases by exactly K, no matter the size of the data set.
- The standard deviation remains unchanged, no matter the size of the data set.
Here is the reasoning for why the mean increases by K:
- If there are N data points and the old mean was M, then the old total of all the data points was MN.
- If we add K to every data point (all N of them), we are adding KN to the total. This gives us a new total of MN + KN = (M + K)N.
- After we divide by N, we get (M + K)N / N = M + K as our new mean. This is K larger than the original mean M.
Here is the reasoning for why the standard deviation remains the same:
- In the original data set, each value is a certain distance from the mean.
- When we add K to every point in the data set, we also add K to the mean.
- Since the mean and all the data points move K units (to the right or left), then the distance between them remains unchanged.
- Even though the values are higher (or lower), they still have the exact same dispersion (distance from the mean) as before.
- Thus, the standard deviation remains unchanged.
(You can learn more about when the mean increases or decreases here).
Example: Adding A Constant To Every Value In A Data Set
For the data set
- A = {1, 2, 2, 3, 3, 3, 4, 4, 5}
we have:
- Mean of A = 3
- Standard deviation of A = 1.225
If we add a value of K = 10 to every point in the data set, we get a new data set:
- B = {11, 12, 12, 13, 13, 13, 14, 14, 15}
we have:
- Mean of A = 13
- Standard deviation of A = 1.225
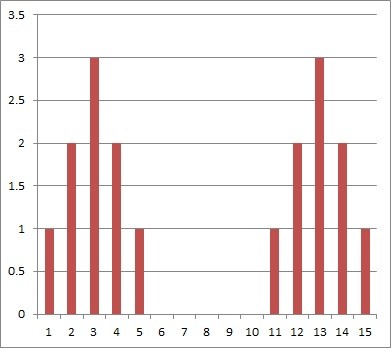
This shows that adding a constant value K to every data point increases the mean by K, but leaves the standard deviation unchanged.
You can see this in the chart below: the data set on the left (from Data Set A) has the same distribution (spread) as the data set on the right (from Data Set B). However, Data Set B is shifted 10 units to the right, since we added 10 to every data point.
Just remember that multiplying every point in a data set by a value K affects both mean and standard deviation (as we will see in a later example).
You can learn more about what affects standard deviation in my article here.
How Are Mean & Standard Deviation Related?
Mean and standard deviation are both used to help us describe a data set and explore what the data set looks like. They are often used together to give confidence intervals for data that follows a normal distribution.

(You can learn more about what mean is used for in my article here, and more about where standard deviation is used in my article here).
Recall from earlier that mean is used to calculate standard deviation according to the formula:
So, both mean and standard deviation take all values in the data set into account. Also, both mean and standard deviation are affected by outliers.
In addition, both mean and standard deviation are affected by multiplication of data points by a constant value.
Example: Length Unit Conversion (Feet To Inches)
For the data set
- A = {3, 5, 8, 8, 11, 13} (measured in feet)
we have:
- Mean of A = 8
- Standard Deviation of A = 3.689
When we convert the units to inches (multiply each point in A by 12), we get the set
- B = {36, 60, 96, 96, 132, 156} (measured in inches)
In this case, we have:
- Mean of B = 96
- Standard Deviation of B = 44.254
So both the mean and standard deviation are multiplied by 12 when we multiply every data point by the value K = 12.

Conclusion
Now you know the difference between mean and standard deviation. You also know how the two concepts are related and how they are used to tell us about a data set.
You can learn about how to use Excel to calculate standard deviation in this article.
You can learn about the units for standard deviation here.
You can learn more about how to interpret standard deviation here.
You can learn about the difference between standard deviation and standard error here.
You can learn more about mean and what it is used for in my article here.
You might also want to learn what it means when data is 1, 2 or 3 standard deviations above (or below) the mean.
The geometric mean is another measure of central tendency – you can learn about it here.
You might also want to learn about the concept of a skewed distribution (find out more here).
I hope you found this article helpful. If so, please share it with someone who can use the information.
Don’t forget to subscribe to my YouTube channel & get updates on new math videos!
~Jonathon