
“What was the class average?” After a particularly difficult test, this is often a common question students and even parents sometimes ask. Another word for “average” is “mean,” in particular, “arithmetic mean.”
You’ve likely calculated the mean of a set of data before. In this article, we’ll explore the mean at length. We’ll answer the question, “what does the mean mean?” (Sorry about the pun.)
So let’s get started!
As a reminder, a measure of central tendency is a single value that attempts to describe a set of data by identifying the central position within that set of data. The mean is a measure of central tendency.
| Mean: The mean of a data set is the average of the numbers. To find the mean, add the numbers in the set and divide by the number of numbers. |
Example
Raghu went to the movies six times over the summer. The running times (in minutes) of each of the movies he saw were as follows: 121, 92, 89, 130, 155 and 133. Find the mean of the running times of the summer movies Raghu saw.
Solution
Calculating the mean is easy enough – we simply add the numbers and divide by 6, the total number of items in the data set:
- (121 + 92 + 89 + 130 + 155 + 133)/6 =
- 720/6 =
- 120
The mean running time of the summer movies Raghu saw is 120 minutes.
When calculating the mean, it’s important to remember the units that are being measured!
That problem was pretty straightforward. Let’s look at a problem that’s a bit more challenging.
Example
After four equally weighted history exams, the mean grade of Louisa’s history exams is 76%. After the 5th history exam, Louisa wants to have an average of 80%.
What is the least grade she needs to earn on the 5th test in order to have an average of 80%?
Solution
For a problem like this, we aren’t given the actual grades that Louisa scored on the four exams. We simply know that the mean grade is 76%.
In order to solve this problem, we can find the sum of her four history exams. For example, she could have had the following grades that would average to 76:
- 76, 76, 76, 76
- 70, 70, 82, 82
- 60, 60, 92, 92
In each case, the sum of the numbers is the same – 304. When 304 is divided by 4 we get the mean of 76%.
So, Lousia has 304 points so far on her history exams. After the 5th exam, she wants to have an average of 80%. This means she needs:
- 5*80 = 400 points
So, she has 304 points and she needs 400 points. To find the grade she needs to earn on the 5th test, we simply calculate the difference in these values:
- 400 – 304 = 96
Hence, Louisa needs a grade of 96% on the next test in order to have a mean grade of 80%.
Sometimes, we’re given a table of values to work with. Often the table will include a frequency column to better display repeated data.
Example
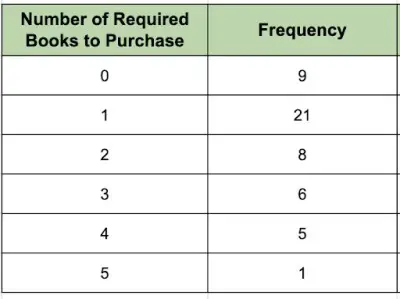
At the local university, 50 different courses are offered to incoming freshmen. The number of books required to purchase varies according to the table below.
What is the mean number of books required to purchase, rounded to the nearest tenth?
Solution
In order to calculate the mean, we need to take into account the frequency of the number of required books. Math students sometimes ignore the frequency column and find the mean of the first column of numbers, which doesn’t take into account the different frequencies.
It’s important to keep in mind the size of the data set so we avoid that mistake! In our example, we’re actually finding the mean of 50 data items.
To find the mean, we can multiply the number of required books by the frequency. We can easily do this in a spreadsheet like Excel or Google Sheets, as shown in the table below. We can also calculate the sum of the products.
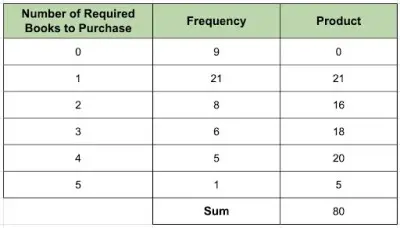
The mean is equal to the sum of the products divided by the total number of courses. We have:
- Mean = 80/50
- Mean = 1.6
Hence, the mean number of books required to purchase for the freshmen class is 1.6 books.
Another measure of central tendency is the median. Recall that the median is the middle number when the numbers are arranged in either ascending or descending order.
If there are an even number of items in the data set, the median is the mean of the two middle numbers.
Both the mean and the median are measures of central tendency and can be used to describe a set of data. Sometimes looking at all of the data in a set can be overwhelming.
It’s helpful to have a few summary statistics like the mean and median to help us quickly draw some conclusions about a data set. It seems as though the mean and median should generally be close in value to each other.
This isn’t always the case, as we’ll see from the next two examples.
What does it mean when the mean is greater than the median?
Example
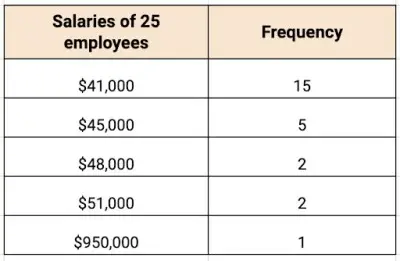
There are 25 employees at a small company in the area. Find the mean and median salary of the employees.
Solution
First, let’s calculate the mean. Once again, we can take the product of the rows, then add the products.
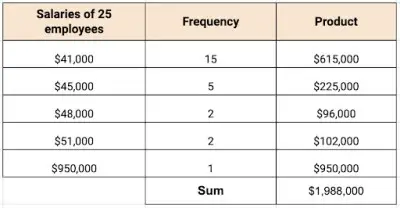
To find the mean, we take the sum and divide by the number of employees:
- Mean = 1,988,000/25
- Mean = 79,520
The mean of the employees’ salaries is $79,520.
To find the median, we can use the frequency column. Notice that the salaries are already listed in increasing order.
The middle number of 25 numbers will be the 13th number on the list. Starting at the top of the list, we see that the first 15 numbers on the list are $41,000.
The median falls within this range, so the median of the employees’ salaries is $41,000. Let’s think about this. The mean is significantly higher than the median! What’s going on?
If the company wanted to make it seem as though they were a high paying company they could brag, “the average salary of our employees is over $79,000.” This would be a true statement though very misleading.
In fact, only one employee, probably the CEO, makes over $79,000. The median, on the other hand, paints a more accurate picture of salaries at the company.
Regarding the mean, one of the salaries, $950,000, is much higher than the rest of the data. When this happens, the data point is called an outlier.
An outlier drags the mean in the direction of the outlier. It’s possible to have more than one outlier.
In any case, we can see that the salary of $950,000 is an outlier and is causing the mean to be very high. An outlier can also be a number that is significantly lower than the rest of the data.
Let’s look at another situation.
What does it mean when the mean is less than the median?
Example
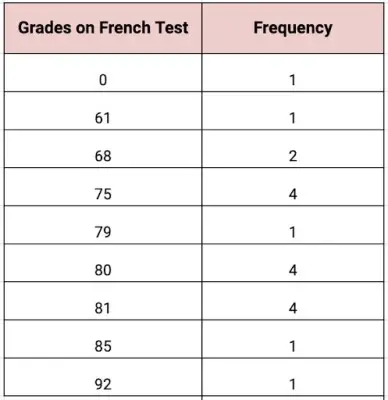
The French teacher at Roosevelt High School posted the results of a recent test according to the table below. Find the mean and median grade on the test.
Solution
Just like in the last problem, let’s start by calculating the mean. If we add the frequencies, we see that there are 19 students in the class. Now, we can take the product of the rows, then add those products.
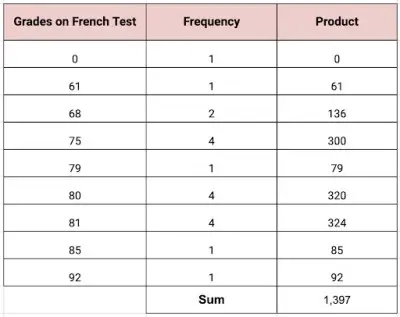
To find the mean, we take the sum and divide by the number of students:
- Mean = 1,397/19
- Mean = 73.526
Rounded to the nearest tenth, the mean grade for the French test was 73.5%.
To find the median, we can use the frequency column. Notice that the grades are already listed in increasing order.
Since there are 19 grades, the middle number will be the 10th number on the list. Starting at the top of the list, we can add the frequencies until we get 10 numbers.
We can see that if we add the first 5 rows, we’ll have 1 + 1 + 2 + 4 + 1 = 9 grades. So, the 10th number will occur in the 6th row with a grade of 80. The median grade on the French test was 80%.
In this case, the mean is significantly lower than the median! If we take a closer look at the data, we can see what’s going on – someone scored 0% on the exam.
This grade is an outlier and drags the mean down. The median seems to be a better indicator of how students did on this test.
Sometimes, the mean has its limitations! The mean can be misleading which is why it’s important to have other descriptive statistics as well!
Now let’s look at a different type of example where we don’t have a list of discrete numbers, but rather grouped data or data that is placed in intervals. How can we find the mean in this situation?
How to find the arithmetic mean of grouped data
Reference: Mean of Group Data
Example
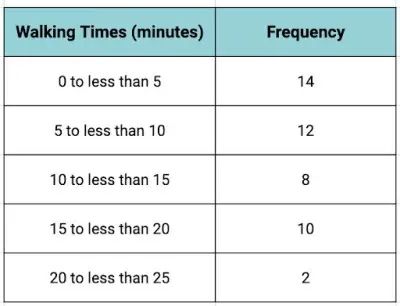
At Lincoln Middle School, there are 46 students who walk to school. What is the mean walking time (in minutes)?
Solution
In our previous examples, we could multiply the rows together to get the product of the frequencies and the numbers. But, in this situation, we don’t have the actual walking times.
We just have a range of numbers. To find the mean, the process is still relatively straightforward. We can find the midpoint of each interval, then multiply the midpoint by the frequency and proceed as before. Not too bad, right?
We can calculate the midpoint easily enough – just find the average (or mean!) of the endpoints of the interval. So we obtain:
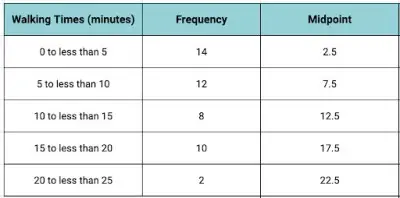
Now, we can find the product of the frequency column and the midpoint and add the product column as shown:
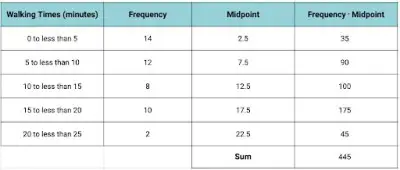
To find the mean, we divide the sum by the total number of students:
- Mean = 445/46
- Mean = 9.67
Rounded to the nearest tenth, the mean walking time for students at Lincoln Middle School is 9.7 minutes.
Other Uses of the Mean in Data Analysis
We’ve seen how the mean can be used to provide a summary or snapshot of a set of data. In addition to providing us with a summary statistic, it can also help us calculate the standard deviation.
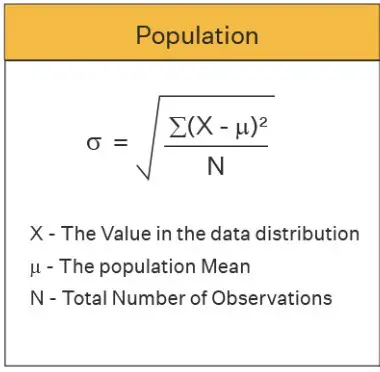
The standard deviation of a data set, denoted by 𝜎, measures the spread of the data. The standard deviation is another descriptive statistic that gives us a better idea of how the data is dispersed around the center.
The standard deviation is calculated by finding the squared distances from the mean. Take a look at the formula for the population standard deviation 𝜎, which uses the population mean μ in the calculation:
Reference: Standard Deviation
Together with the standard deviation, the mean can be used to describe data sets that are approximately normally distributed.
(You can learn more about the differences between mean and standard deviation here).
The mean is also helpful when comparing data from two different populations. For example, suppose there are two college science classes, each with 200 students.
On a midterm exam, Class 1 had a mean score of 70% with a standard deviation of 10 points. Class 2 also had a mean score of 70% with a smaller standard deviation of 5 points.
What does this tell us about the two populations? The classes have the same test average but the second classes’ grades clustered more around the mean. The grades weren’t as spread out.
It should be noted that there is a difference between the population mean and the sample mean. The formula above is for population means. Often in practice, it’s too difficult to calculate the mean of an entire population so researchers use the sample mean to make estimates about the population mean.
As we’ve seen, the mean is super useful in statistics. There are so many more uses for the mean. It is used in hypothesis testing, constructing confidence intervals for a set of data, computing expected value and making informed predictions for the future performance of a set of data.
Some statistics are resistant to outliers, while others are not – you can learn more here.
You can find out when the mean changes (and what affects it) here.
You can learn how to find the mean in Excel here.
You can learn about some uses of mean here.
I hope you found this article helpful. If so, please share it with someone who can use the information.

Don’t forget to subscribe to our YouTube channel & get updates on new math videos!
About the author:
Jean-Marie Gard is an independent math teacher and tutor based in Massachusetts. You can get in touch with Jean-Marie at https://testpreptoday.com/.