
Are you trying to figure out what happens to the mean of a data set when you add or remove a point? The change in the mean really depends on how the data point relates to the original mean.
So, when does mean change? The mean changes if you add or remove a value not equal to the original mean. Mean increases if you add a value larger than the original mean or remove a value smaller than the original mean. Mean decreases if you add a value smaller than the original mean or remove a value larger than the original mean.
Of course, the mean stays the same if we add or remove a data point with the same value as the original mean. We can also use a formula to calculate the change in mean, based on the value of the point we removed and the number of values in the data set.
In this article, we’ll talk about when the mean changes: when it increases, when it decreases, and when it stays the same. We’ll also take a look at what happens when you add or subtract constant numbers to the values in a data set.
Let’s get started.
When Does Mean Change?
The mean of a data set changes if you add or remove a value that is not equal to the original mean.
Remember the formula for the mean M of a data set:
- M = (x1 + x2 + … + xn) / n
where x1, x2, … , xn are the n values in the data set.
We can also use the shorter form with the sigma (summation) symbol:
- M = ∑xi / n
When is the new mean the same as the old mean? We can use the first formula above to help us find out.
The original mean is M, as given with the formula above: M = (x1 + x2 + … + xn) / n.
After we remove a point (let’s say we remove x1), the mean will be M’ = (x2 + … + xn) / (n-1). This is because x1 is no longer included in the data set (and so we divide by n-1 instead of n, since there is one less data point!)
To make calculations easier, let S = x1 + x2 + … + xn (that is, S is the sum of all n of the original data points). Then the mean is M = S/n.
Now, the old mean M and the new mean M’ are equal when:
- M = M’
- (x1 + x2 + … + xn) / n = (x2 + … + xn) / (n-1) [used formulas for M and M’]
- S / n = (S – x1) / (n – 1) [since S = x1 + x2 + … + xn]
- S(n – 1)= n(S – x1) [cross multiplied to get rid of fractions]
- Sn – S = nS – nx1 [distribute through parentheses]
- –S = –nx1 [subtract Sn from both sides]
- S = nx1
- S / n = x1
- M = x1
So, the only way to keep the mean the same after removing a data point is if its value is the same as the original mean M.
A similar proof, given below, shows that the only way to keep the mean the same after adding a data point is if its value is the same as the original mean M.
How To Calculate Mean Change
When we add or remove a data point, we can calculate the change in the mean. This will require the formulas mentioned earlier.
If we remove a data point, then the mean change is the new mean minus the old mean, or:
- M’ – M
- =[(S – x1) / (n-1)] – [S / n]
- =[n(S – x1) / n(n-1)] – [(n-1)S / n(n-1)] [find a common denominator]
- =[n(S – x1) – (n-1)S] / n(n-1)
- =[n(S – x1) – (n-1)S] / n(n-1)
- =[nS – nx1 – nS + S] / n(n-1) [distribute through both sets of parentheses]
- =[-nx1 + S] / n(n-1)
- =[-nx1 / n(n-1)] + S/n(n-1) [separate into two fractions]
- =-x1/(n+1) + M/(n-1) [since M = S/n]
- =(M – x1) / (n – 1)
In other words, to find the mean change after removing a data point, we subtract the value of the data point from the mean, and then divide the result by n – 1 (the size of the data set after removing the value).
If we add a new data point xn+1, then the mean change is the new mean minus the old mean, or:
- M’ – M
- =[(S + xn+1) / (n+1)] – [S / n]
- =[n(S + xn+1) / n(n+1)] – [(n+1)S / n(n+1)] [find a common denominator]
- =[n(S + xn+1) – (n+1)S] / n(n+1)]
- =[nS + nxn+1 – nS – 1S] / n(n+1)] [distribute through both sets of parentheses]
- =[nxn+1 – S] / n(n+1)]
- =[nxn+1/n(n+1)] – [S / n(n+1)] [separate into two fractions]
- =[xn+1/(n+1)] – [M/(n+1)] [since M = S/n]
- =(xn+1 – M) / (n + 1)
In other words, to find the mean change after adding a new data point, we subtract the original mean point from the value of the new data point, and then divide the result by n + 1 (the size of the data set after adding the new value).
When Does Mean Increase?
Mean increases if you add a value larger than the original mean or remove a value smaller than the original mean. Remember that an increase in the mean is the same as a positive change in the mean.
The question is, when do we see a positive change in the mean? We can use the formulas from before to find out.
When we remove a data point, the mean change is (M – x1)/ (n – 1). This change will be positive when M – x1 > 0, or M > x1.
In other words, if we remove a data point whose value is less than the original mean, then the new mean will be greater than the original one.
When we add a data point, the mean change is (xn+1 – M) / (n + 1). This change will be positive when xn+1 – M > 0, or xn+1 > M.
In other words, if we add a data point whose value is greater than the original mean, then the new mean will be greater than the original one.
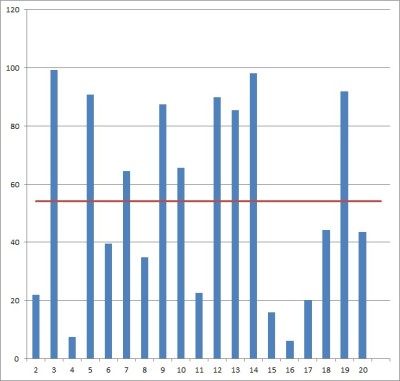
Example 1: When Mean Increases After Removing A Data Point
Consider the set of data points {1, 2, 3, 4, 5, 6, 7, 8, 9, 10}.
The original mean is (1 + 2 + 3 + 4 + 5 + 6 + 7 + 8 + 9 + 10) / 10 = 55/10 = 5.5.
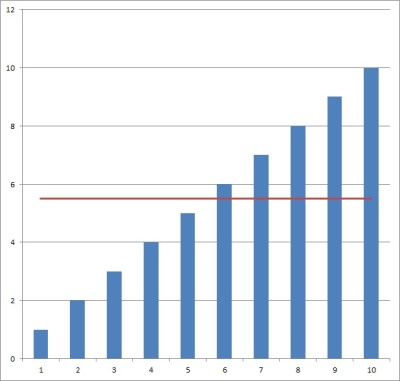
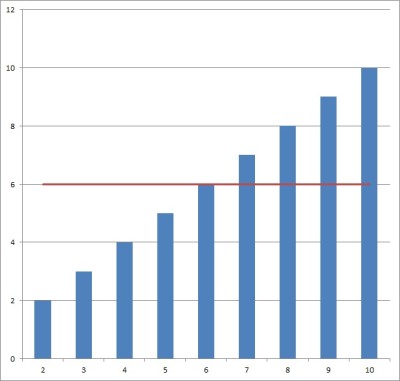
If we remove a data point that is less than the mean (let’s say we remove 1), the new mean should be less than 5.5. We can check this to verify.
The new mean is (2 + 3 + 4 + 5 + 6 + 7 + 8 + 9 + 10) / 9 = 54/9 = 6.
Example 2: When Mean Increases After Adding A Data Point
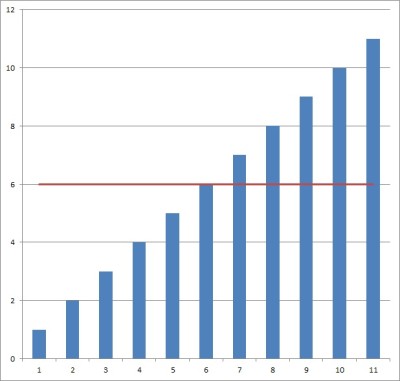
Consider the set of data points {1, 2, 3, 4, 5, 6, 7, 8, 9, 10}.
The original mean is (1 + 2 + 3 + 4 + 5 + 6 + 7 + 8 + 9 + 10) / 10 = 55/10 = 5.5.
If we add a data point that is greater than the mean (let’s say we add 11), the new mean should be greater than 5.5. We can check this to verify.
The new mean is (1 + 2 + 3 + 4 + 5 + 6 + 7 + 8 + 9 + 10 + 11) / 11 = 66/11 = 6.
When Does Mean Decrease?
Mean decreases if you add a value smaller than the mean or remove a value larger than the original mean.
The question is, when do we see a negative change in the mean? We can use the formulas from before to find out.
When we remove a data point, the mean change is (M – x1)/ (n – 1). This change will be negative when M – x1 < 0, or M < x1.
In other words, if we remove a data point whose value is greater than the original mean, then the new mean will be less than the original one.
When we add a data point, the mean change is (xn+1 – M) / (n + 1). This change will be negative when xn+1 – M < 0, or xn+1 < M.
In other words, if we add a data point whose value is less than the original mean, then the new mean will be less than the original one.
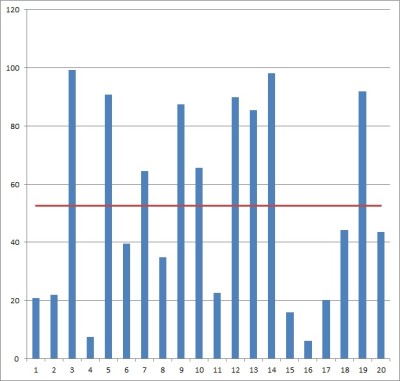
Example 1: When Mean Decreases After Removing A Data Point
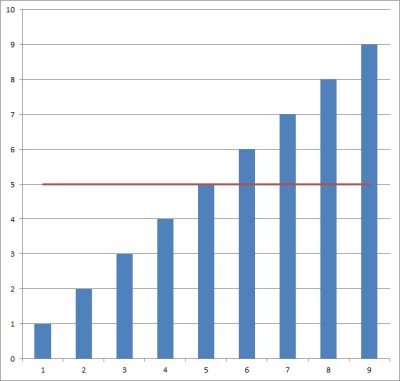
Consider the set of data points {1, 2, 3, 4, 5, 6, 7, 8, 9, 10}.
The original mean is (1 + 2 + 3 + 4 + 5 + 6 + 7 + 8 + 9 + 10) / 10 = 55/10 = 5.5.
If we remove a data point that is greater than the mean (let’s say we remove 10), the new mean should be less than 5.5. We can check this to verify.
The new mean is (1 + 2 + 3 + 4 + 5 + 6 + 7 + 8 + 9) / 9 = 45/9 = 5.
Example 2: When Mean Decreases After Adding A Data Point
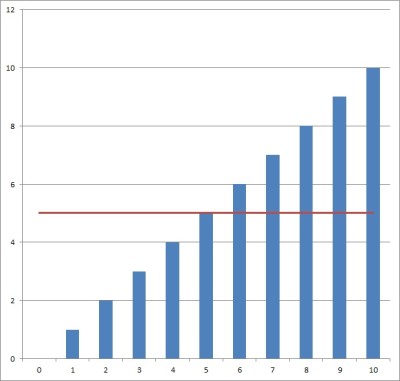
Consider the set of data points {1, 2, 3, 4, 5, 6, 7, 8, 9, 10}.
The original mean is (1 + 2 + 3 + 4 + 5 + 6 + 7 + 8 + 9 + 10) / 10 = 55/10 = 5.5.
If we add a data point that is less than the mean (let’s say we add 0), the new mean should be less than 5.5. We can check this to verify.
The new mean is (0 + 1 + 2 + 3 + 4 + 5 + 6 + 7 + 8 + 9 + 10) / 11 = 55/11 = 5.
When Does Mean Stay The Same?
Remember, we proved earlier that the only way the mean can stay the same is if we add or remove a data point whose value is exactly equal to the original mean.
Of course, we can find out what happens if we add or remove more than one data point. However, the calculations become a little more involved at that point.
What Happens To The Mean When You Add A Constant?
When you add the same constant value “K” to every value in a data set, the mean increases by K.
In other words, if the mean of the data set {x1, x2, … , xn} is M, then the mean of the data set {x1+ K, x2, + K, … , xn + K} is M + K.
When you add the constant value “K” to a single value in a data set, the mean increases by K/n (where n is the number of points in the data set).
What Happens To The Mean When You Multiply By A Constant?
When you multiply every value in the data set by the same constant value “K” to every value in a data set, the mean is multiplied by K.
In other words, if the mean of the data set {x1, x2, … , xn} is M, then the mean of the data set {Kx1, Kx2, … , Kxn} is KM.
*Note: if you combine multiplication and addition, the new mean is changed accordingly.
For example, let’s say that M is the mean of the data set {x1, x2, … , xn}. If every data point is subject to the transformation f(xi) = axi + b, then the new mean is aM + b .
Conclusion
Now you know when mean changes: when it increases, when it decreases, and when it stays the same. You also know how to calculate changes in the mean, based on which data point was added or removed and how large the data set is.
You can find out about how mean is used in real-life in this article.
I hope you found this article helpful. If so, please share it with someone who can use the information.

Don’t forget to subscribe to our YouTube channel & get updates on new math videos!