
Percentages tell us the “how much per hundred” when we have a fraction (part divided by whole). The concept of percentages is helpful in numerous situations in everyday life.
So, what are percentages used for? Percentages are used in business, finance, taxation, sports, nutrition, medicine, and anywhere statistics are applied. We can use a percentage from a sample to make an estimate for an entire population. We can also use percentages to compare two groups or to rate the effectiveness of a treatment.
Of course, there are too many uses of percentages to list, but we’ll take a look at some common ones.
In this article, we’ll explore what percentages are used for in real life and how they can help us to make better decisions in many scenarios.
Let’s get started.
What Are Percentages?
A percentage tells us the part out of 100. The word percentage (or percent) comes from the Latin “per centum”, which means “by a hundred” or “per 100”.
Percentage is calculated by taking a fraction (part divided by whole), converting to a decimal, and then converting to a percent by multiplying by 100 (that is, moving the decimal point 2 places right) and adding a percent symbol.
For example, if 42 out of 50 people read at least one book each month, we convert the fraction 42/50 (part/whole) to the decimal 0.84. Then, we move the decimal point 2 places right and add a percent symbol to get 84%.
What Are Percentages Used For? (11 Real-Life Uses Of Percentages)
Percentages are useful in many different real-life applications, including:
- Estimating a population percentage from a sample percentage
- Comparing two or more groups
- Rating the effectiveness of a treatment
- Checking completeness of a task
- Tracking performance of an individual
- Calculating discounts at a store
- Nutrition (vitamins, minerals, etc.)
- Sports (statistics about batting average, etc.)
- Finance (interest rates, both simple and compound)
- Tax rates (income, sales, and property tax)
- Business (profit margin, click through rate, etc.)
Let’s take a closer look at each of these, starting with estimating population percentages.
Estimating A Population Percentage From A Sample
Sometimes we want to find how many people (or what percentage) in a population have a certain trait. However, it is difficult to poll an entire population if the group is large or hard to reach.
Instead, we can take a representative sample from the population, calculate a percentage for the sample, and then apply this to the population as a whole to get a reasonable estimate.
Note that we want a representative sample from the population. This means that if we are looking at all adults in the U.S., we don’t want to take a sample from just one state.
Example: Using Percentages To Estimate Population Parameters From Sample Statistics
Let’s say we have a population of 100,000 people in a city and we want to find out how many read at least one book per week.

Since there are so many people in the population, it will be difficult to poll the entire city. Instead, we will use a representative sample to make an estimate.
After randomly selecting people to poll, we get responses from a sample of 1,000 people in the city. The data shows that 85 of them read at least one book per week.
To find the percentage, we calculate the fraction 85/1000 (part over whole), which gives us a decimal of 0.085. To get a percentage, we multiply by 100 and add a percent symbol to get 8.5%.
So, 8.5% of the sample reads at least one book per week. Assuming our sample is representative of the city population as a whole, we can apply this percentage to the entire group.
To calculate 8.5% of 100,000 people, we multiply the decimal form of 8.5% (0.085) by 100,000 to get 8,500 people.
So, we estimate that 8,500 people in the city read at least one book per week.
You can learn more about the difference between a parameter and a statistic in this article.
Comparing Two Or More Groups
We can also use percentages to compare two or more groups. This can help us to find out which group is higher or lower in percentage terms, rather than absolute terms.
Example: Using Percentages To Compare Two Groups
Let’s say that we have two cities:
- City A has 4,120 robberies per year and a population of 200,000.
- City B has 1,050 robberies per year and a population of 30,000.
At first glance, it looks like City A might be more dangerous, since there are almost 4 times as many robberies in City A compared to City B.
However, if we calculate percentages based on population, we can get an “apples to apples” comparison.
- For City A, we calculate 4,120 / 200,000 = 0.0206, or 2.06%
- For City B, we calculate 1,050 / 30,000 = 0.035, or 3.50%
As it turns out, the number of robberies in City B is less than in City A, but the smaller population of City B means that it has a higher robbery rate: 3.50% compared to 2.06% in City A.
You are about 70% more likely to be robbed in City B than in City A (3.50% / 2.06% = 1.699, or 170%, meaning the chance of robbery in City B is 70% higher than in City A).

Rating The Effectiveness Of A Treatment
Let’s say we want to find out how much a treatment improves a metric we are tracking. The treatment could be a prescription medication or a diet plan, and the metric could be blood pressure, cholesterol, or other measures.
Example: Using Percentage To Rate Effectiveness Of A Treatment
Let’s say we have two groups of people: one group goes on a specific diet, and the other group is a control group (meaning they don’t change their behavior at all).

After a year on the diet, the first group has an average weight loss of 8%. The second group has an average weight loss of 0% (no change).
It appears that the diet may have some effect on weight loss. However, we would need to do a hypothesis test to see if the diet really does have an effect.
We might have a null hypothesis that “the diet has no effect”, and our test would determine whether we reject that hypothesis or not. The outcome of the hypothesis test would depend on several things, including:
- the size of each group in the diet study
- the significance level (5%, 1%, etc.)
Checking Completeness Of A Task
Percentages can help us in project management and workforce planning. By keeping track of progress on a task or project completeness, we can figure out when to reallocate resources (labor, equipment, etc.)
Example: Using Percentages To Check Completeness Of Tasks
Let’s say you have two teams of workers: Team A and Team B. They are working on the same task (making repairs) at different locations.
- Team A has 5 workers and has completed 40% of the task in 1 day.
- Team B has 12 workers and has completed 24% of the task in 1 day.
If we want the two teams to finish at about the same time, we might want to move some of the workers from one team to another.

On average, each member of Team A has done 8% of the task (40% / 5 = 8%) over 1 day.
On the other hand, each member of Team B has done 2% of the task (24% / 12 = 2%) over 1 day.
The workers in Team A are working faster, and their task is closer to being complete. So, we might want to move some workers from Team A to Team B.
If we move 2 workers from Team A to Team B, Team A will finish 24% per day, while Team B will now finish 40% per day.
Instead of Team A being done in 2.5 days and Team B in just over 4 days, both teams will be done within 3 days. This will save us an entire day if we want both teams to go to work on another project.
Tracking Performance
We can also record percentages over time to track performance for a variety of metrics.
Example: Using Percentages To Track Performance Over Time
A salesman wants to track his percentage of sales made (out of calls made) every month for a year. Each month, he takes the fraction (sales made) / (calls made) and finds the percentage.
Over the course of a year, he can track the percentages to see how he is progressing over time. The graph below shows the salesman’s progress throughout the year:
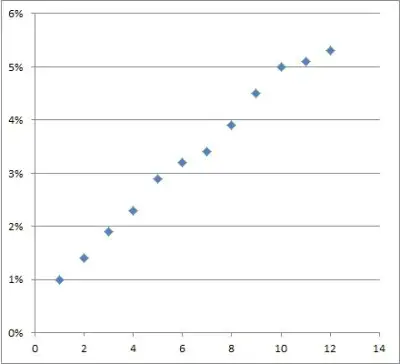
We can see that the salesman has made steady progress in improving over the past year (1 = January, 12 = December).
Calculating Discounts
We can use percentages to calculate discounts for retail sales.
Example: Using Percentages to Calculate Discounts
If the price of an item is normally $12.00 and there is a 15% off sale, we can calculate the amount of the discount by multiplying the usual price ($12.00) by the discount percentage (15%, or 0.15 as a decimal).

This gives us a discount amount of ($12.00)(0.15) = $1.80. So, the discounted price is $12.00 – $1.80 = $10.20.
Note that we can also find this amount by multiplying $12.00 by 85% (100% minus a 15% discount leaves us with 85% of the original price). This also gives us a discounted price of ($12.00)(0.85) = $10.20.
Nutrition
Percentages are used in nutrition to indicate how much of a vitamin or mineral a food contains. For example, a cup of 2% fat milk contains 5% of the daily recommended sodium intake.
We can use these percentages to find out how much of a food to eat to get the recommended amount of nutrition.
Example: Using Percentages For Nutrition
Let’s say that you want to find out how many almonds to eat to get all of the necessary manganese for one day. One ounce of almonds has about 30% of the manganese for one day’s nutrition.

To get to 100%, you would need to eat X ounces of almonds, where
- 30X = 100
- X = 100 / 30
- X = 3.33
So you would need to eat about 3.33 ounces of almonds per day to get 100% of your daily manganese requirement.
Sports
Percentages are often used in sports to compare two players on one or more factors, such as batting average in baseball.
Example: Using Percentages In Baseball To Calculate Batting Average
In 2019, a baseball player was at-bat 230 times and hit 50 times.
In 2020, the same player was at-bat 240 times and hit 62 times.
The batting averages for those years are as follows:
- 2019: 50 / 230 = 0.217 or “two seventeen” (21.7%)
- 2020: 62 / 240 = 0.258 or “two fifty eight” (25.8%)
So, this player’s batting average increased by 4.1% from 2019 to 2020.
If we want to find the batting average for both years combined, we would need to take a weighted average, since there are a different number of at-bats each year:
- 2019 & 2020: (50 + 62) / (230 + 240) = 112 / 470 = 0.238 or “two thirty eight” (23.8%)
This percentage is a little closer to the 2020 average than the 2019 average, since there is more “weight” (more at-bats) for 2020 than for 2019.

Finance
In finance, we use percentages to calculate rates of return for assets. This gives us a way to compare the performance of two difference investments.
Example: Using Percentages To Compare Two Investments
Let’s say we are considering an investment in one of two companies:
- Company A has increased in value from $100 per share to $312 per share over the past decade.
- Company B has increased in value from $25 per share to $99 per share over the past decade.

To find out which company has a higher investment return over the past decade, we will calculate percentage increases. Remember that percentage increase (or decrease) is given by the formula
- 100*(new – old) / old
For the two companies, we get:
- Company A: 100(312 – 100) / 100 = 212%
- Company B: 100(99 – 25) / 25 = 296%
So the price of a share in Company A has increased by 212% over the past decade, while the price of a share in Company B has increased by 296% over the past decade.
So, Company B was the better investment during the past decade. (Note: this ignores any volatility of returns or dividends paid by either company).
Tax rates
Percentages are used for income taxes, sales taxes, and property taxes. The percentages depend on the income bracket (federal income tax), or state (state income tax or sales tax), and the city (property tax).
Example: Calculating Sales Tax
Let’s say that you buy an item that costs $400 in a state with a sales tax of 5%. This means that the sales tax you owe is 5% of $400, or ($400)(0.05) = $20.
So the total price you pay is $420 ($400 for the item plus $20 in taxes to the state).
Note that we can also calculate this amount if we multiply by a factor of (1 + R), where R is the sales tax rate. Here, R = 0.05 (5%), so the factor is 1 + R = 1.05.
If we multiply $400 by 1.05, we get $420, the same result as before.
Business
Percentages are used in all kinds of calculations for business, including profit margins (for every business) and CTR (click through rate) for online businesses.
Example: Using Percentages To Find Profit Margin
Let’s say that a business has revenue of $200,000 from sales and expenses of $110,000 per year.
Remember that profit is given by revenue minus expenses, so the profit for this business is
- Profit = Revenue – Expenses = $200,000 – $110,000 = $90,000
Profit margin is a percentage given by profit divided by revenue. For this business, the profit margin is:
- Profit Margin = Profit / Revenue = $90,000 / $200,000 = 0.45 (45%)
So, this business has a profit margin of 45%.
If we decrease expense s by$18,000 (from $110,000 to $92,000), we see a large effect on profit margin:
- Profit = Revenue – Expenses = $200,000 – $92,000 = $108,000
- Profit Margin = Profit / Revenue = $108,000 / $200,000 = 0.54 (54%)
So profit margin increases by 9%, and the company’s total profit increases by 20%.
Conclusion
Now you know what percentages are used for and how they can help us to learn and make better decisions in many areas of life.
You can learn more about data literacy in my article here.
You can learn how to calculate percentages in Excel here.
You can learn about various uses of algebra in real life here.
I hope you found this article helpful. If so, please share it with someone who can use the information.
Don’t forget to subscribe to my YouTube channel & get updates on new math videos!
~Jonathon