
Mean and standard deviation are both used to help describe data sets, especially ones that follow a normal distribution. We can also figure out how “extreme” a data point is by calculating how many standard deviations above or below the mean it is.
So, what do standard deviations above or below the mean tell us? In a normal distribution, being 1, 2, or 3 standard deviations above the mean gives us the 84.1st, 97.7th, and 99.9th percentiles. On the other hand, being 1, 2, or 3 standard deviations below the mean gives us the 15.9th, 2.3rd, and 0.1st percentiles.
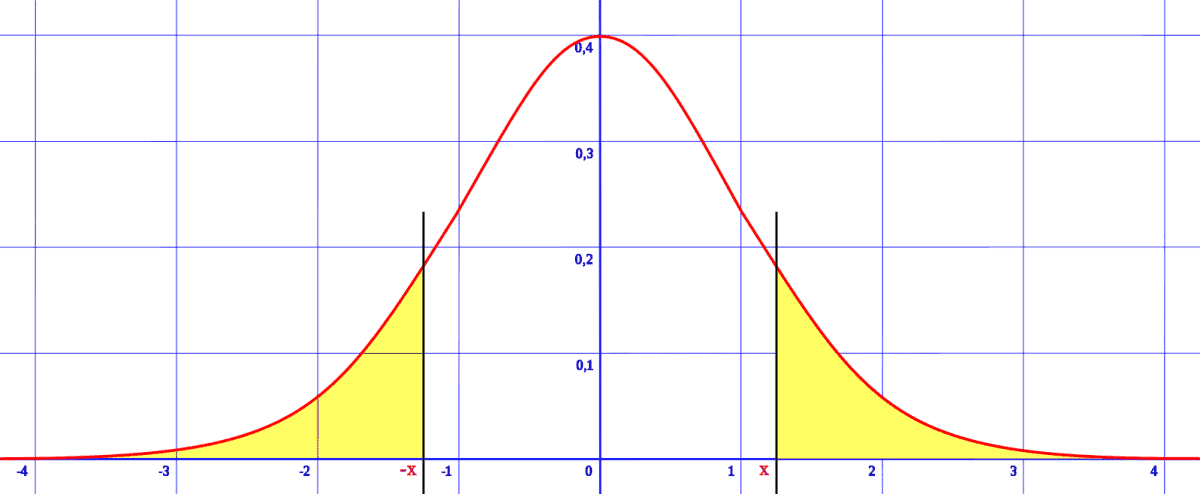
Of course, converting to a standard normal distribution makes it easier for us to use a standard normal table (with z scores) to find percentiles or to compare normal distributions.
In this article, we’ll talk about standard deviations above the mean and what it means, along with examples to make the concept clear.
Let’s get started.
Having math trouble?
Looking for a tutor?

1, 2, Or 3 Standard Deviations Above The Mean
When a data point in a normal distribution is above the mean, we know that it is above the 50th percentile. This is because the mean of a normal distribution is also the median, and thus it is the 50th percentile.

We can use a standard normal table to find the percentile rank for any data value from a normal distribution. However, we first need to convert the data to a standard normal distribution, with a mean of 0 and a standard deviation of 1.
To do this, we first subtract the value of the mean M of the distribution from every data point. This changes the mean from M to 0, but leaves the standard deviation unchanged.
(You can learn more about when the mean increases or decreases here).
Then, we divide every data point by the standard deviation S of the distribution. This leaves the mean at 0, but changes the standard deviation from S to 1.
The formula is given by:
- Z = (X – M) / S
where X is the variable for the original normal distribution and Z is the variable for the standard normal distribution.
Example: Converting A Normal Distribution To A Standard Normal Distribution
Let’s say we have a normal distribution with mean M = 200 and standard deviation S = 40.
To convert to a standard normal distribution, we subtract the mean (M = 200) from every data point. Then, we divide every data point by the standard deviation (S = 40).
The formula is given by:
- Z = (X – M) / S
- Z = (X – 200) / 40
Then Z has a mean of 0 and a standard deviation of 1 (a standard normal distribution).
We can find a specific value of Z for any given value of X. For example, given the data point X = 260 in the original normal distribution, we get the following Z-value in the standard normal distribution:
- Z = (X – M) / S
- Z = (260 – 200) / 40 [X = 260]
- Z = 60 / 40
- Z = 1.5
So a value of 260 in the normal distribution is equivalent to a z-score of 1.5 in a standard normal distribution.
One Standard Deviation Above The Mean
For a data point that is one standard deviation above the mean, we get a value of X = M + S (the mean of M plus the standard deviation of S).
In a standard normal distribution, this value becomes Z = 0 + 1 = 1 (the mean of zero plus the standard deviation of 1).
A data point one standard deviation above the mean is the 84.1st percentile, which we can see in a standard normal table with z = 1.0.
Example: One Standard Deviation Above The Mean
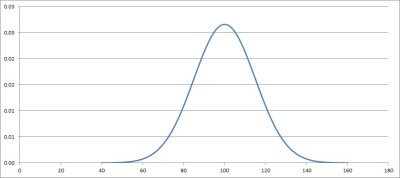
Given a normal distribution with a mean of M = 100 and a standard deviation of S = 15, we calculate a value of M + S = 100 + 15 = 115 is one standard deviation above the mean.
So, a value of 115 is the 84.1st percentile for this particular normal distribution. This corresponds to a z-score of 1.0.
Two Standard Deviations Above The Mean
For a data point that is two standard deviations above the mean, we get a value of X = M + 2S (the mean of M plus twice the standard deviation, or 2S).
In a standard normal distribution, this value becomes Z = 0 + 2*1 = 2 (the mean of zero plus twice the standard deviation, or 2*1 = 2).
A data point two standard deviations above the mean is the 97.7th percentile, which we can see in a standard normal table with z = 2.0.
Example: Two Standard Deviations Above The Mean
Given a normal distribution with a mean of M = 100 and a standard deviation of S = 15, we calculate a value of M + 2S = 100 + 2*15 = 130 is two standard deviations above the mean.
So, a value of 130 is the 97.7th percentile for this particular normal distribution. This corresponds to a z-score of 2.0.
Three Standard Deviations Above The Mean
For a data point that is three standard deviations above the mean, we get a value of X = M + 3S (the mean of M plus three times the standard deviation, or 3S).
In a standard normal distribution, this value becomes Z = 0 + 3*1 = 3 (the mean of zero plus three times the standard deviation, or 3*1 = 3).
A data point three standard deviations above the mean is the 99.9th percentile, which we can see in a standard normal table with z = 3.0.
Example: Three Standard Deviations Above The Mean
Given a normal distribution with a mean of M = 100 and a standard deviation of S = 15, we calculate a value of M + 3S = 100 + 3*15 = 145 is three standard deviations above the mean.
So, a value of 145 is the 99.9th percentile for this particular normal distribution. This corresponds to a z-score of 3.0.
Having math trouble?
Looking for a tutor?
1, 2, Or 3 Standard Deviations Below The Mean
When a data point in a normal distribution is below the mean, we know that it is below the 50th percentile. This is because the mean of a normal distribution is also the median, and thus it is the 50th percentile.
Since a normal distribution is symmetric about the mean (mirror images on the left and right), we will get corresponding percentiles on the left and right sides of the distribution.
For instance, a value that is one standard deviation above the mean gives us the 84.1st percentile. A value that is one standard deviation below the mean gives us the 15.9th percentile.
The relationship is that the two percentiles add up to 100: 84.1 + 15.9 = 100.
One Standard Deviation Below The Mean
For a data point that is one standard deviation below the mean, we get a value of X = M – S (the mean of M minus the standard deviation of S).
In a standard normal distribution, this value becomes Z = 0 – 1 = -1 (the mean of zero minus the standard deviation of 1).
A data point one standard deviation below the mean is the 15.9th percentile, which we can see in a standard normal table with z = -1.0.
Example: One Standard Deviation Below The Mean
Given a normal distribution with a mean of M = 100 and a standard deviation of S = 15, we calculate a value of M – S = 100 – 15 = 85 is one standard deviation below the mean.
So, a value of 115 is the 84.1st percentile for this particular normal distribution. This corresponds to a z-score of -1.0.
Two Standard Deviations Below The Mean
For a data point that is two standard deviations below the mean, we get a value of X = M – 2S (the mean of M minus twice the standard deviation, or 2S).
In a standard normal distribution, this value becomes Z = 0 – 2*1 = -2 (the mean of zero minus twice the standard deviation, or 2*1 = 2).
A data point two standard deviations below the mean is the 2.3rd percentile, which we can see in a standard normal table with z = -2.0.
Example: Two Standard Deviations Below The Mean
Given a normal distribution with a mean of M = 100 and a standard deviation of S = 15, we calculate a value of M – 2S = 100 – 2*15 = 70 is two standard deviations below the mean.
So, a value of 70 is the 2.3rd percentile for this particular normal distribution. This corresponds to a z-score of -2.0.
Three Standard Deviations Below The Mean
For a data point that is three standard deviations below the mean, we get a value of X = M – 3S (the mean of M minus three times the standard deviation, or 3S).
In a standard normal distribution, this value becomes Z = 0 – 3*1 = -3 (the mean of zero plus three times the standard deviation, or 3*1 = 3).
A data point three standard deviations below the mean is the 0.1st percentile, which we can see in a standard normal table with z = -3.0.
Example: Three Standard Deviations Below The Mean
Given a normal distribution with a mean of M = 100 and a standard deviation of S = 15, we calculate a value of M – 3S = 100 – 3*15 = 55 is three standard deviations below the mean.
So, a value of 555 is the 0.1st percentile for this particular normal distribution. This corresponds to a z-score of -3.0.
Conclusion
Now you know what standard deviations above or below the mean tell us about a particular data point and where it falls within a normal distribution.
You can learn about the units for standard deviation here.
You can learn more about data literacy in my article here.
You can learn more about the differences between mean and standard deviation in my article here.
This article I wrote will reveal what standard deviation can tell us about a data set.
You can learn about how to use Excel to calculate standard deviation in this article.
You can learn more about how to interpret standard deviation here.
You can learn about the difference between standard deviation and standard error here.
You might also want to learn about the concept of a skewed distribution (find out more here).
I hope you found this article helpful. If so, please share it with someone who can use the information.
Don’t forget to subscribe to my YouTube channel & get updates on new math videos!
~Jonathon