
Standard deviation is used often in statistics to help us describe a data set, what it looks like, and how it behaves. However, this raises the question of how standard deviation helps us to understand data.
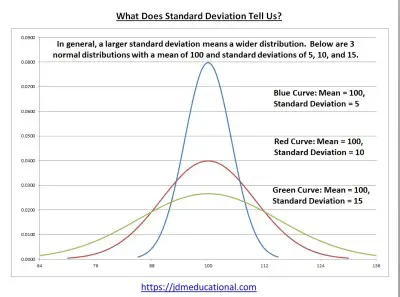
So, what does standard deviation tell us? Standard deviation tells us about the variability of values in a data set. It is a measure of dispersion, showing how spread out the data points are around the mean. Together with the mean, standard deviation can also indicate percentiles for a normally distributed population.
Of course, standard deviation can also be used to benchmark precision for engineering and other processes. It can also tell us how accurate predictions have been in the past, and how likely they are to be accurate in the future.
In this article, we’ll talk about standard deviation and what it can tell us. We’ll also mention what “N standard deviations from the mean” refers to in a normal distribution.
Let’s get started.
(You can also watch a video summary of this article on YouTube).
Having math trouble?
Looking for a tutor?

What Does Standard Deviation Tell Us?
Standard deviation is a number that tells us about the variability of values in a data set. That is, standard deviation tells us how data points are spread out around the mean.
(You can learn more about what affects standard deviation in my article here).
Standard deviation is a measure of dispersion, telling us about the variability of values in a data set. Compare this to the mean, which is a measure of central tendency, telling us where the average value lies.
Standard deviation tells us how far, on average, each data point is from the mean:
- A large value for standard deviation means that the data is spread far out, with some of it far away from the mean. That is, on average, a given data point is far from the mean.
- A small value for standard deviation means that the data is clustered near the mean. That is, on average, a given data point is close to the mean.
- A zero value for standard deviation means that all of the data has the same value (which is also the value of the mean). This situation is rare, but it is possible.
Together with the mean, standard deviation can also tell us where percentiles of a normal distribution are. Remember that a percentile tells us that a certain percentage of the data values in a set are below that value.
For example, let’s say the 80th percentile of IQ test scores is 113. This means that 80 percent of people have an IQ below 113.
Alternatively, it means that 20 percent of people have an IQ of 113 or above. So, if your IQ is 113 or higher, you are in the top 20% of the sample (or the population if the entire population was tested).
For a normal distribution, the following table summarizes some common percentiles based on standard deviations above the mean (M = mean, S = standard deviation).
| Standard Deviations From Mean | Percentile (Percent Below Value) |
|---|---|
| M – 3S | 0.15% |
| M – 2S | 2.5% |
| M – S | 16% |
| M | 50% |
| M + S | 84% |
| M + 2S | 97.5% |
| M + 3S | 99.85% |
table summarizes some common
percentiles based on standard
deviations above the mean
(M = mean, S = standard deviation).
In practical terms, standard deviation can also tell us how precise an engineering process is. For example, a small standard deviation in the size of a manufactured part would mean that the engineering process has low variability.
We can also decide on a tolerance for errors (for example, we only want 1 in 100 or 1 in 1000 parts to have a “defect”, which we could define as having a size that is 2 or more standard deviations above or below the desired mean size.
You can learn more about the difference between mean and standard deviation in my article here.
Example: Two Data Sets With The Same Mean & Sample Size, But Different Standard Deviations
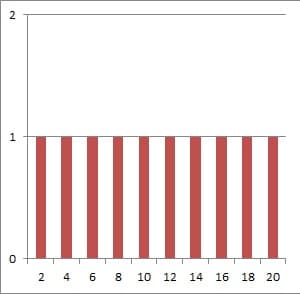
Consider the following two data sets with N = 10 data points:
- A = {2, 4, 6, 8, 10, 12, 14, 16, 18, 20}
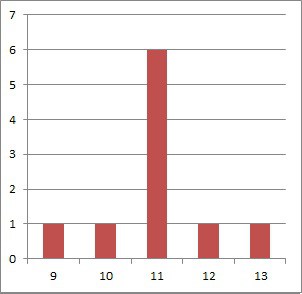
- B = {9, 10, 11, 11, 11, 11, 11, 12, 13}
For the first data set A, we have a mean of 11 and a standard deviation of 6.06.
For the second data set B, we have a mean of 11 and a standard deviation of 1.05.
Both data sets have the same sample size and mean, but data set A has a much higher standard deviation. This is due to the fact that there are more data points in set A that are far away from the mean of 11.
Data set B, on the other hand, has lots of data points exactly equal to the mean of 11, or very close by (only a difference of 1 or 2 from the mean).
As you can see from the graphs below, the values in data in set A are much more spread out than the values in data in set B.
Why Use Standard Deviation Instead Of Variance?
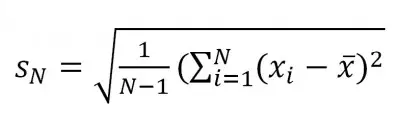
Remember that standard deviation is the square root of variance. This raises the question of why we use standard deviation instead of variance.
When we calculate variance, we take the difference between a data point and the mean (which gives us linear units, such as feet or pounds).
When we square these differences, we get squared units (such as square feet or square pounds). To get back to linear units after adding up all of the square differences, we take a square root.
Why Use Standard Deviation Instead Of Range?
Remember that the range of a data set is the difference between the maximum and the minimum values. Using the range of a data set to tell us about the spread of values has some disadvantages:
- Range only takes into account two data values from the set: the maximum and the minimum. The rest of the data values are ignored.
- Range does not tell us anything about how far the average data point is from the mean. In fact, range does not take the mean into account at all.
- Range is highly susceptible to outliers, regardless of sample size. Whenever the minimum or maximum value of the data set changes, so does the range – possibly in a big way.
Standard deviation, on the other hand, takes into account all data values from the set, including the maximum and minimum.
Standard deviation also tells us how far the average value is from the mean of the data set.
Finally, when the minimum or maximum of a data set changes due to outliers, the mean also changes, as does the standard deviation. However, for larger sample sizes, this effect is less pronounced.
How Do You Interpret Standard Deviation?
A low standard deviation means that the data in a set is clustered close together around the mean. A high standard deviation means that the data in a set is spread out, some of it far from the mean.
The best way to interpret standard deviation is to think of it as the spacing between marks on a ruler or yardstick, with the mean at the center.

Every time we travel one standard deviation from the mean of a normal distribution, we know that we will see a predictable percentage of the population within that area.

Having math trouble?
Looking for a tutor?
What Is A Low Standard Deviation?
A low standard deviation is one where the coefficient of variation (CV) is less than 1. The coefficient of variation is defined as
- CV = (standard deviation of data set) / (mean of data set)
Note that CV < 1 implies that the standard deviation of the data set is less than the mean of the data set.
It is also important to note that a mean close to zero will skew the coefficient of variation to a high value. Even worse, a mean of zero implies an undefined coefficient of variation (due to a zero denominator).
In the example from earlier, we have coefficients of variation of:
- Data Set A: CV = (standard deviation of data set) / (mean of data set) = 6.06 / 11 = 0.55.
- Data Set B: CV = (standard deviation of data set) / (mean of data set) = 1.05 / 11 = 0.10.
What Is A High Standard Deviation?
A high standard deviation is one where the coefficient of variation (CV) is greater than 1. Note that CV > 1 implies that the standard deviation of the data set is greater than the mean of the data set.
This is more likely to occur in data sets where there is a great deal of variability (high standard deviation) but an average value close to zero (low mean).
What Is 1 Standard Deviation From The Mean?
When we say “1 standard deviation from the mean”, we are talking about the following range of values:
- (M – S, M + S)
where M is the mean of the data set and S is the standard deviation.
We know that any data value within this interval is at most 1 standard deviation from the mean. We could say that this data is relatively close to the mean.
For example, if we have a data set with mean 200 (M = 200) and standard deviation 30 (S = 30), then the interval
- (M – S, M + S)
- =(200 – 30, 200 + 30)
- =(170 , 230)
Is the range of values that are one standard deviation (or less) from the mean.
What Percentage Is 1 Standard Deviation From The Mean?
For a data set that follows a normal distribution, approximately 68% (just over 2/3) of values will be within one standard deviation from the mean.
So, for every 1000 data points in the set, 680 will fall within the interval (S – E, S + E).
Going back to our example above, if the sample size is 1000, then we would expect 680 values (68% of 1000) to fall within the range (170, 230).
What Is 2 Standard Deviations From The Mean?
When we say “2 standard deviations from the mean”, we are talking about the following range of values:
- (M – 2S, M + 2S)
where M is the mean of the data set and S is the standard deviation.
We know that any data value within this interval is at most 2 standard deviations from the mean. Some of this data is close to the mean, but a value 2 standard deviations above or below the mean is somewhat far away.
For example, if we have a data set with mean 200 (M = 200) and standard deviation 30 (S = 30), then the interval
- (M – 2S, M + 2S)
- =(200 – 2(30), 200 + 2(30))
- =(140 , 260)
Is the range of values that are 2 standard deviations (or less) from the mean.
What Percentage Is 2 Standard Deviations From The Mean?
For a data set that follows a normal distribution, approximately 95% (19 out of 20) of values will be within 2 standard deviations from the mean.
So, for every 1000 data points in the set, 950 will fall within the interval (S – 2E, S + 2E).
Going back to our example above, if the sample size is 1000, then we would expect 950 values (95% of 1000) to fall within the range (140, 260).
What Is 3 Standard Deviations From The Mean?
When we say “3 standard deviations from the mean”, we are talking about the following range of values:
- (M – 3S, M + 3S)
where M is the mean of the data set and S is the standard deviation.
We know that any data value within this interval is at most 3 standard deviations from the mean. Some of this data is close to the mean, but a value 3 standard deviations above or below the mean is very far away from the mean (and this happens rarely).
For example, if we have a data set with mean 200 (M = 200) and standard deviation 30 (S = 30), then the interval
- (M – 3S, M + 3S)
- =(200 – 3(30), 200 + 3(30))
- =(110 , 290)
Is the range of values that are 3 standard deviations (or less) from the mean.
What Percentage Is 3 Standard Deviations From The Mean?
For a data set that follows a normal distribution, approximately 99.7% (997 out of 1000) of values will be within 3 standard deviations from the mean.
So, for every 1000 data points in the set, 997 will fall within the interval (S – 3E, S + 3E).
Going back to our example above, if the sample size is 1000, then we would expect 997 values (99.7% of 1000) to fall within the range (110, 290).
What Is 4 Standard Deviations From The Mean?
When we say “4 standard deviations from the mean”, we are talking about the following range of values:
- (M – 4S, M + 4S)
where M is the mean of the data set and S is the standard deviation.
We know that any data value within this interval is at most 4 standard deviations from the mean. Some of this data is close to the mean, but a value that is 4 standard deviations above or below the mean is extremely far away from the mean (and this happens very rarely).
For example, if we have a data set with mean 200 (M = 200) and standard deviation 30 (S = 30), then the interval
- (M – 4S, M + 4S)
- =(200 – 4(30), 200 + 4(30))
- =(80 , 320)
Is the range of values that are 4 standard deviations (or less) from the mean.
What Percentage Is 4 Standard Deviations From The Mean?
For a data set that follows a normal distribution, approximately 99.99% (9999 out of 10000) of values will be within 4 standard deviations from the mean.
So, for every 10000 data points in the set, 9999 will fall within the interval (S – 4E, S + 4E).
Going back to our example above, if the sample size is 10000, then we would expect 9999 values (99.99% of 10000) to fall within the range (80, 320).
What Is 5 Standard Deviations From The Mean?
When we say “5 standard deviations from the mean”, we are talking about the following range of values:
- (M – 5S, M + 5S)
where M is the mean of the data set and S is the standard deviation.
We know that any data value within this interval is at most 5 standard deviations from the mean. Some of this data is close to the mean, but a value that is 5 standard deviations above or below the mean is extremely far away from the mean (and this almost never happens).
For example, if we have a data set with mean 200 (M = 200) and standard deviation 30 (S = 30), then the interval
- (M – 5S, M + 5S)
- =(200 – 5(30), 200 + 5(30))
- =(50 , 350)
Is the range of values that are 5 standard deviations (or less) from the mean.
What Percentage Is 5 Standard Deviations From The Mean?
For a data set that follows a normal distribution, approximately 99.9999% (999999 out of 1 million) of values will be within 5 standard deviations from the mean.
So, for every 1 million data points in the set, 999,999 will fall within the interval (S – 5E, S + 5E).
Going back to our example above, if the sample size is 1 million, then we would expect 999,999 values (99.9999% of 10000) to fall within the range (50, 350).
The probability of a person being outside of this range would be 1 in a million.
Conclusion
Now you know what standard deviation tells us and how we can use it as a tool for decision making and quality control. You also know how it is connected to mean and percentiles in a sample or population.
You can learn more about standard deviation (and when it is used) in my article here.
You can also learn about the factors that affects standard deviation in my article here.
You can learn about the difference between standard deviation and standard error here.
You can learn about when standard deviation is a percentage here.
You might also want to check out my article on how statistics are used in business.
You can learn about how to use Excel to calculate standard deviation in this article.
You might also want to learn about the concept of a skewed distribution (find out more here).
I hope you found this article helpful. If so, please share it with someone who can use the information.
Don’t forget to subscribe to my YouTube channel & get updates on new math videos!
~Jonathon