
It is one thing to calculate a standard deviation from a data set. However, it is another to interpret it and find out what it is telling you about a data set.
So, how do you interpret standard deviation? Standard deviation, S, is a measure of dispersion (how spread out is data about the mean?) Standard deviation has the same units as the mean, M, and we can use both values to find probabilities for a normal distribution. The coefficient of variation S/M tells us if standard deviation is low or high.
Of course, standard deviation (and mean) can change if we change the units of measurement. However, the coefficient of variation will not change when we change units.
In this article, we’ll talk about how to interpret standard deviation. We’ll also answer some common questions about standard deviation as well.
Let’s get started.
How To Interpret Standard Deviation
In simple terms, standard deviation is a descriptive statistic tells us how spread out a data set is. It indicates the variability of the values in a data set.
Let’s look at the formula for standard deviation to get a better sense of what it means and how to interpret it.
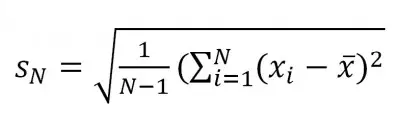
The formula for sample standard deviation is:
[image from othe
While the formula for population standard deviation is:
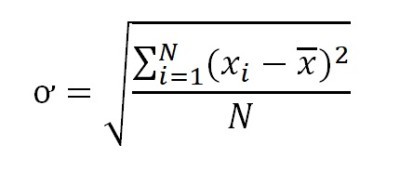
(You can learn more about the differences between these two formulas and when to use each one here).
We will focus on sample standard deviation here (the first equation above). Let’s start by expanding the equation into a series of steps that are easier to understand.
To find the sample standard deviation, take the following steps:
- 1. Calculate the mean of the sample (add up all the values and divide by the number of values).
- 2. Calculate the difference between the sample mean and each data point (this tells you how far each data point is from the mean).
- 3. Square the differences from Step 2 (squaring introduces a larger “penalty” for values that are far away from the mean).
- 4. Sum the squared differences from Step 3 (the squaring in step 3 ensures a nonnegative sum here, but gives us squared units).
- 5. Divide the sum from Step 4 by n – 1 (the sample size minus one).
- 6. Take the square root of the quotient from Step 5 (taking the square root brings us back to the same units as the mean).
As you can see in the following table, a value that is close to the mean does not contribute much to the sum of squared differences in step 4. However, a value far away from the mean contributes a large amount.
| Distance Of Value From Mean | Amount Added To Squared Sums |
|---|---|
| 0 | 0 |
| 1 | 1 |
| 2 | 4 |
| 3 | 9 |
| 4 | 16 |
| 5 | 25 |
| 10 | 100 |
| 20 | 400 |
| 50 | 2500 |
| 100 | 10000 |
away from the mean contribute
more to the sum of squared
differences (used in finding
standard deviation).
At the extreme low end, a standard deviation of 0 means that the value of every data point in the set is the same. In this special case, the mean is equal to the value of every data point.
For example, if every data point had a value of 2, then the mean would be 2, and the standard deviation would be 0.
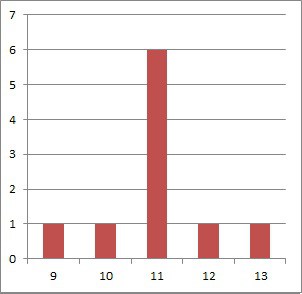
A small standard deviation means that there is some spread in the data, but most of it is still in a fairly tight cluster close to the mean.
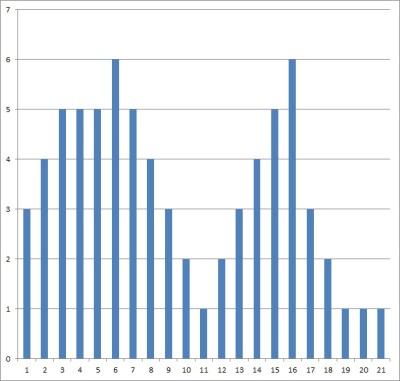
As data points become spread out further from the mean, the standard deviation increases.
You can learn more about what standard deviation tells us in this article.
How Do You Tell If A Standard Deviation Is High Or Low?
One way to tell if a given standard deviation is high or low is to use the coefficient of variation. This allows you to compare the standard deviation to the mean (which has the same units and is used to find the standard deviation).
The coefficient of variation (CV) of a data set is defined as:
- CV = S / M
where S is the standard deviation of the data set and M is its mean (average).
The coefficient of variation can give us an idea of how the standard deviation compares to the mean:
- A CV of less than 1 means that the standard deviation is low. It also tells us that the standard deviation is less than the mean.
- A CV of more than 1 means that the standard deviation is high. It also tells us that the standard deviation is greater than the mean.
For example, let’s say we have two data sets:
- Data Set A has a mean of 10 and a standard deviation of 2.
- Data Set B has a mean of 1 and a standard deviation of 2.
Although the standard deviation is the same for both data sets, the coefficient of variation will differ quite a bit:
- CV for Data Set A: S / M = 2 / 10 = 0.2
- CV for Data Set B: S / M = 2 / 1 = 2
So, the standard deviation of 2 is considered low for data set A, but it is considered high for data set B.
It is important to note that a mean close to zero will skew the coefficient of variation to a high value.
Even worse, a mean of zero implies an undefined coefficient of variation (due to a zero denominator). Note that you will always have a zero mean for a standard normal distribution (since the mean is 0 and the standard deviation is 1).

The sample size will also affect sample standard deviation, which can influence the coefficient of variation.
Is A Standard Deviation Of 1 High?
A standard deviation of 1 may be high or low – it depends on the data set and its mean.
For a data set with a mean of 100 and a standard deviation of 1, the coefficient of variation is:
- CV = S/M = 1/100 = 0.01
This coefficient of variation is far less than 1, so a standard deviation of 1 is low in this case.
On the other hand, for a data set with a mean of 0.1 and a standard deviation of 1, the coefficient of variation is:
- CV = S/M = 1/0.1 = 10
This coefficient of variation is far greater than 1, so a standard deviation of 1 is high in this case.
Note: for a standard normal distribution, the standard deviation is always 1, due to shifting the variable X with the formula Z = (X – M)/S.
In this case, a standard deviation of 1 is neither high nor low, since the coefficient of variation is S/M = 1/0, which is undefined.
(You can learn how to find z scores in Excel here).
Does Higher Standard Deviation Mean More Risk?
A higher standard deviation does not necessarily mean more risk. For the following example, let’s say you define risk as “risk of financial loss”.

Compare these two investments in terms of risk:
- One investment that returns -5%, guaranteed (mean of -5%, standard deviation of 0%).
- Another investment that returns an average of 10%, with a standard deviation of 1%.
Although the standard deviation is higher for the 2nd investment, it is arguably less risky. The reason is that there is almost no chance of loss with the 2nd investment, while you are guaranteed a loss of 5% with the first investment.
The reason that a loss is so unlikely is: for a normal distribution with an average return of 10% and a standard deviation of 1%, the chance of a negative return is near zero. The z-score in this case is:
- Z = (X – M)/S = (0% – 10%)/1% = -10
The probability of a value from a standard normal distribution being less than -10 is close to zero.
To summarize: when assessing risk, the mean matters just as much as the standard deviation. You should take both into account when making decisions regarding the risk/reward balance.
Conclusion
Now you know how to interpret standard deviation, along with how to get a sense of whether it is high or low (relative to the mean).
Read this article to learn more about where standard deviation is used in real life.
You can learn about when standard deviation is a percentage here.
You can learn about the central limit theorem and its connection to the normal distribution here.
You can learn about how to work with normal distributions in Excel here.
I hope you found this article helpful. If so, please share it with someone who can use the information.

Don’t forget to subscribe to our YouTube channel & get updates on new math videos!