
Standard deviation is used often in statistics to help us describe the spread of a data set (dispersion about the mean). If we cannot poll the entire population, we can use a sample to estimate the standard deviation.
So, what is the difference between sample and population standard deviation? Sample standard deviation is a statistic based on a subset of the population, and population standard deviation is a parameter that takes every member of the population into account. Sample standard deviation estimates the population standard deviation when we cannot poll an entire population.
Of course, when estimating a population parameter from a sample, a larger sample is better (as long as we are using a representative sample). Taking a sample of only a few data points from the population will not tell us much.
In this article, we’ll talk about the difference between sample standard deviation and population standard deviation. We’ll also look at some examples to see how the two differ.
Let’s get started.
Difference Between Sample & Population Standard Deviation
The main differences between sample & population standard deviation are:
- sample standard deviation is a statistic based on a sample (subset) of the population, while population standard deviation is a parameter that takes into account every member of the population.
- when calculating sample standard deviation, we divide by n – 1 (sample size minus one), but when calculating population standard deviation, we divide by N (population size).
- the population standard deviation cannot be “wrong”, since it takes all data points into account, while the sample standard deviation can vary from sample to sample and may differ from the population standard deviation (the sample statistic is often used as an estimate for the population parameter).
The table below summarizes the difference between sample standard deviation and population standard deviation.
| Sample Standard Deviation | Population Standard Deviation |
|---|---|
| statistic | parameter |
| based on a subset of the population | based on the entire population |
| divide by n-1 (sample size minus one) to calculate | divide by N (population size) to calculate |
| gives you an estimate of a parameter | gives you the exact value of parameter |
between the sample standard
deviation and the population
standard deviation.
Remember that it is not always practical to poll an entire population or to get accurate data for a large population, which makes it difficult to find the population standard deviation.
A solution is to take a sample of the population that is large enough to make inferences about the entire population. Then, we can use the sample standard deviation to make an estimate of the population standard deviation.
To avoid bias, we should use a representative sample of the population. For example, if our population is “all U.S. citizens”, then we should not use a sample of women aged 25 to 35 from the state of Florida.
Instead, we should try to find people of all ages from every state for our sample. The larger the sample size “n”, the better, since the sample statistic will approach the value of the population parameter as n gets larger.
How Do You Find The Sample Standard Deviation?
To find the sample standard deviation, take the following steps:
- 1. Calculate the mean of the sample (add up all the values and divide by the number of values).
- 2. Calculate the difference between the sample mean and each data point.
- 3. Square the differences from Step 2.
- 4. Sum the squared differences from Step 3.
- 5. Divide the sum from Step 4 by n – 1 (the sample size minus one).
- 6. Take the square root of the quotient from Step 5.
The formula below gives the formula for the sample standard deviation:
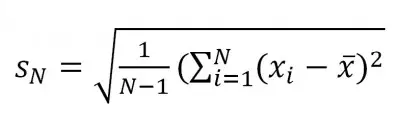
This will give us the sample standard deviation. It helps to use a table to keep track of the values we need to calculate (a spreadsheet makes it easier to find mean, differences, squares, quotients, and square roots).
Let’s take a look at an example to see how it works.
Example: Finding The Sample Standard Deviation
Consider the data set:
- A = {1, 3, 5, 5, 6}
Following the steps above to find the sample standard deviation:
For step 1, we calculate the sample mean. The sample size is n = 5, so:
- Mean = M = (1 + 3 + 5 + 5 + 6) / 5 = 20 / 5 = 4
Now we will use a table to calculate the necessary values for steps 2 and 3:
| Data Value | Value Minus Mean (X-M) | Squared Difference |
|---|---|---|
| 1 | -3 | 9 |
| 3 | -1 | 1 |
| 5 | 1 | 1 |
| 5 | 1 | 1 |
| 6 | 2 | 4 |
from the mean, and squared
differences for the data set.
For step 4, the sum of the square differences (3rd column in the table above) is 9 + 1 + 1 + 1 + 4 = 16.
For step 5, we divide by n – 1. Here n = 5, so n – 1 = 4, and so 16 / (n – 1) = 16 / 4 = 4.
For step 6, we take the square root of 4 to get 2.
So, the sample standard deviation is 2.
How Do You Find The Population Standard Deviation?
To find the population standard deviation, the process is very similar to the one we used for finding samples standard deviation. Here are the steps:
- 1. Calculate the mean of the sample (add up all the values and divide by the number of values).
- 2. Calculate the difference between the sample mean and each data point.
- 3. Square the differences from Step 2.
- 4. Sum the squared differences from Step 3.
- 5. Divide the sum from Step 4 by N (the population size).
- 6. Take the square root of the quotient from Step 5.
The formula below gives the formula for the population standard deviation:
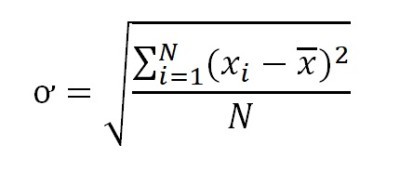
This will give us the population standard deviation. It helps to use a table to keep track of the values we need to calculate (a spreadsheet makes it easier to find mean, differences, squares, quotients, and square roots).
Let’s take a look at an example to see how it works.
Example: Finding The Population Standard Deviation
Consider the data set:
- A = {1, 3, 5, 5, 6}
Following the steps above to find the sample standard deviation:
For step 1, we calculate the sample mean. The sample size is n = 5, so:
- Mean = M = (1 + 3 + 5 + 5 + 6) / 5 = 20 / 5 = 4
Now we will use a table to calculate the necessary values for steps 2 and 3:
| Data Value | Value Minus Mean (X-M) | Squared Difference |
|---|---|---|
| 1 | -3 | 9 |
| 3 | -1 | 1 |
| 5 | 1 | 1 |
| 5 | 1 | 1 |
| 6 | 2 | 4 |
from the mean, and squared
differences for the data set.
For step 4, the sum of the square differences (3rd column in the table above) is 16.
For step 5, we divide by N. Here N = 5, so 16 / 5 = 3.2.
For step 6, we take the square root of 3.2 to get 1.789.
So, the population standard deviation is 1.789. (Note that this is slightly smaller than the sample standard deviation of 2 that we calculated for the same data set in the previous example).
Should I Use Sample Or Population Standard Deviation?
If you have data on the entire population, you will use population standard deviation. The only reason to use sample standard deviation is to make an estimate for a population parameter.
In other words, if you are only able to obtain data from a sample of the population, you will use the sample standard deviation to estimate the population standard deviation.
If you had data on the entire population, you wouldn’t need to estimate the population standard deviation – you could just calculate it from the data.
Conclusion
Now you know the difference between sample and population standard deviation. You also know when to use each one and how to calculate them.
You can learn more about the difference between a parameter and a statistic in this article.
You can learn more about the factors that affect standard deviation in my article here.
You can learn about how to use Excel to calculate standard deviation in this article.
You can learn about the units for standard deviation here.
You can learn more about how to interpret standard deviation here.
You can learn about the difference between standard deviation and standard error here.
I hope you found this article helpful. If so, please share it with someone who can use the information.
Don’t forget to subscribe to my YouTube channel & get updates on new math videos!
~Jonathon