
Standard deviation is an important statistic that helps us to get a sense of the spread of a data set. We can use Excel to help us in our calculations, but there are a few things to be aware of.
So, can Excel calculate standard deviation? Excel can calculate standard deviation for a given data set. The function STDEV (or STDEV.S) will calculate a sample standard deviation, while STDEV.P will calculate a population standard deviation. You can also find standard deviation in Excel manually by using a few operations and a few columns.
Of course, you need to know when to use each of the functions mentioned above (when to use sample vs. population standard deviation).
In this article, we’ll talk about how to calculate standard deviation in Excel and when to use each method. We’ll also look at some examples to make the concept clear.
Let’s get started.
Can Excel Calculate Standard Deviation?
Excel can calculate standard deviation with formulas (for sample or population) and also manually (with several columns).
Before we use these Excel functions, it is important to understand the difference between sample and population standard deviation.
Excel Standard Deviation: Sample vs Population (STDEV vs STDEVP)
Two Excel functions that you can use to calculate standard deviation are:
- STDEV or STDEV.S (this is used to calculate sample standard deviation)
- STDEV.P (this is used to calculate population standard deviation)
Here are some key differences between sample and population standard deviation:
- Sample standard deviation is a statistic based on a subset of the population, and population standard deviation is a parameter that takes every member of the population into account.
- Sample standard deviation estimates the population standard deviation when we cannot poll an entire population.
So, STDEV.S (sample) should be used when we only have data from a subset of the population. On the other hand, STDEV.P (population) should be used when we have data from the entire population.
Here are the equations that we use to calculate both standard deviations:
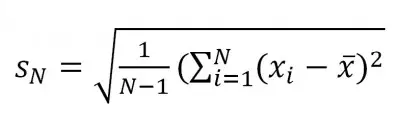
Sample Standard Deviation
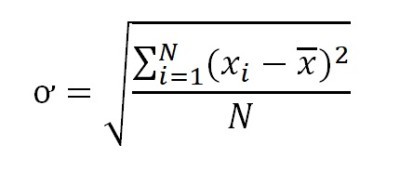
Population Standard Deviation
As you can see, sample and population standard deviation differ by a factor of n – 1 (sample size minus 1) versus a factor of n (population size).
What Does STDEV In Excel Calculate?
To calculate sample standard deviation in Excel, use the STDEV (or STDEV.S) formula. It has the following syntax:
- =STDEV(values)
or
- =STDEV.S(values)
For the “values” input, we can list numbers manually such as 2, 5, 3, … or we can use a range of cells, such as A2:A21.
Let’s look at an example.
Example: Using STDEV.S To Calculate Sample Standard Deviation In Excel
Let’s say we have the following data set in Excel:
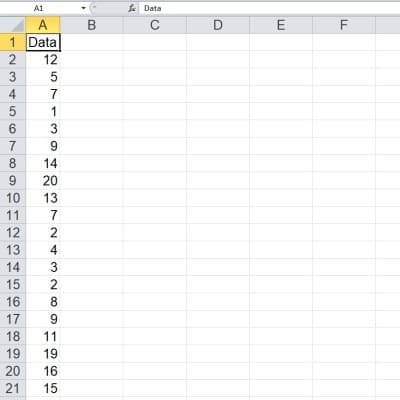
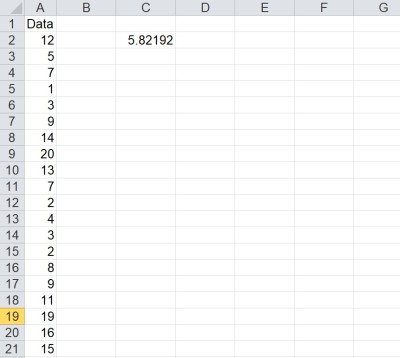
You can see that the data points are in the cell range A2:A21 (there are 20 data points in total).
This data comes from a sample of a population, so it does not include all data from the population. So, we should use the sample standard deviation to analyze this data.
We will use the STDEV.S function with input values from the data range A2:A21:
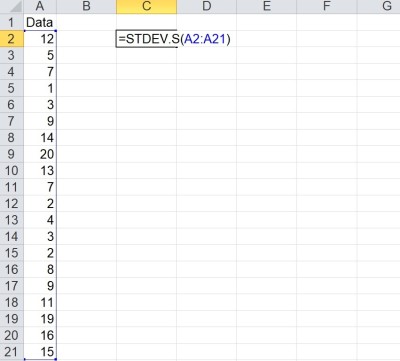
The result is in cell C2, which gives us a sample standard deviation of 5.82192.
What Does STDEV.P In Excel Calculate?
To calculate population standard deviation in Excel, use the STDEV.P formula. It has the following syntax:
- =STDEV.P(values)
For the “values” input, we can list numbers manually such as 2, 5, 3, … or we can use a range of cells, such as A2:A21.
Let’s look at an example.
Example: Using STDEV.P To Calculate Population Standard Deviation In Excel
Let’s say we have the following data set in Excel:
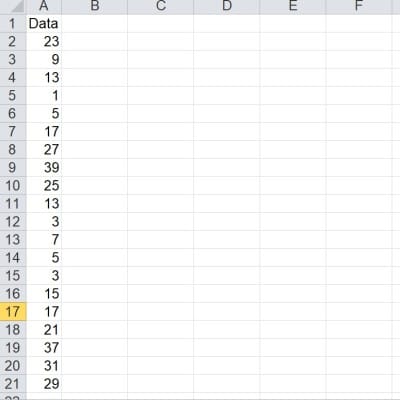
You can see that the data points are in the cell range A2:A21 (there are 20 data points in total).
This data comes from an entire population, so it includes all data from the population. So, we should use the population standard deviation to analyze this data.
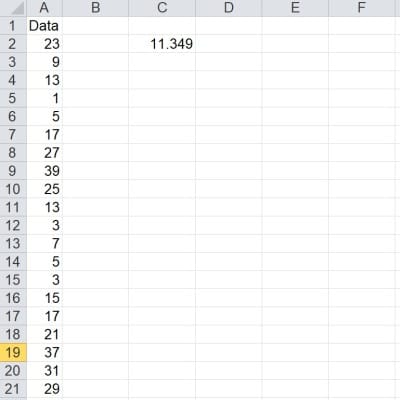
We will use the STDEV.P function with input values from the data range A2:A21:
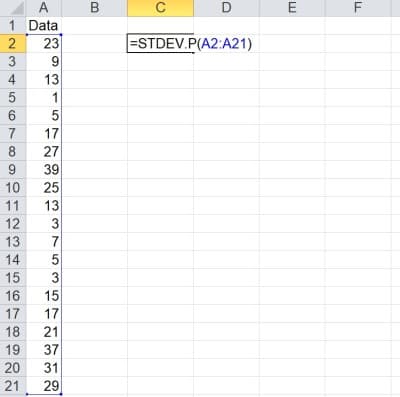
The result is in cell C2, which gives us a population standard deviation of 11.349.
How To Calculate Standard Deviation In Excel Without Formula (Manual Calculation)
We can also calculate standard deviation in Excel without using the STDEV.S or STDEV.P formulas. It takes a little more work, but it gives you some insight into how the calculations work.
Calculating Sample Standard Deviation In Excel Without Formula (Manual Calculation)
To find the sample standard deviation in Excel, take the following steps:
- 1. Calculate the mean of the sample (add up all the values and divide by the number of values).
- 2. Calculate the difference between the sample mean and each data point.
- 3. Square the differences from Step 2.
- 4. Sum the squared differences from Step 3.
- 5. Divide the sum from Step 4 by n – 1 (the sample size minus one).
- 6. Take the square root of the quotient from Step 5.
A reminder, the formula below gives the formula for the sample standard deviation:
Let’s look at an example to see how this is done.
Example: Calculating Sample Standard Deviation In Excel Without Formula
Let’s say we have the following data set in Excel:
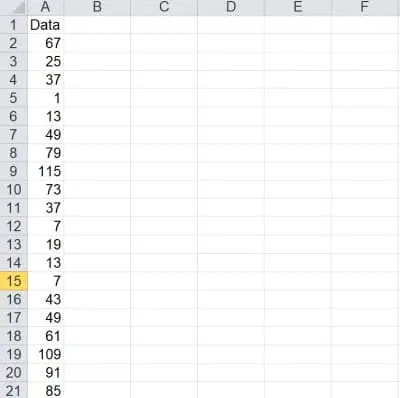
You can see that the data points are in the cell range A2:A21 (there are 20 data points in total).
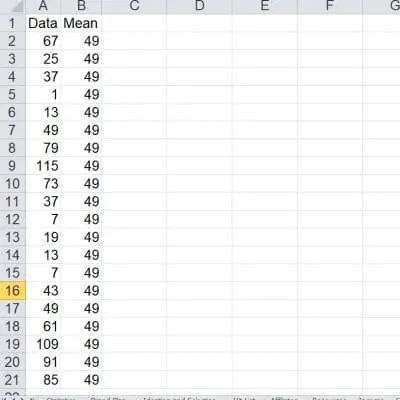
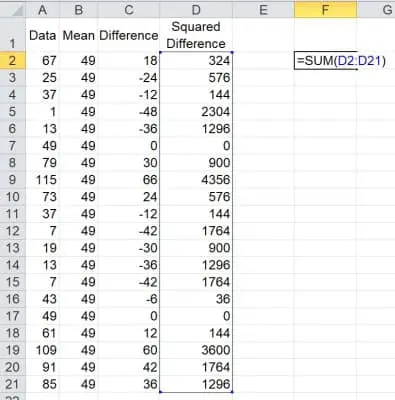
First, we will calculate the mean (which is 49) and copy it down to every cell in the first column. The formula in cell B2 is =AVERAGE(A2:A20).
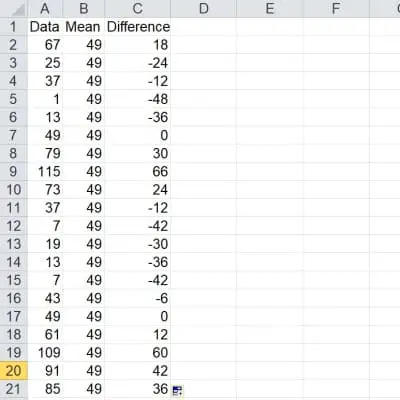
Next, we will calculate the differences between the sample mean and each data point. The formulas in column C are:
- =A2 – B2
- =A3 – B3
- etc.
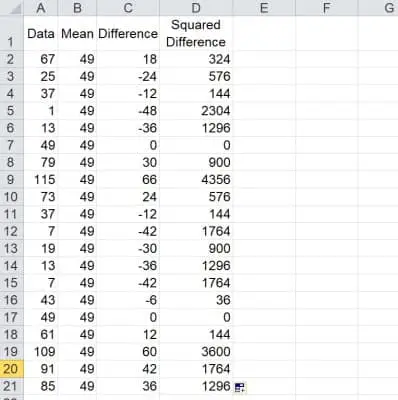
Then, we square the differences. The formulas in column D are:
- =POWER(C2, 2)
- =POWER(C3, 2)
- etc.
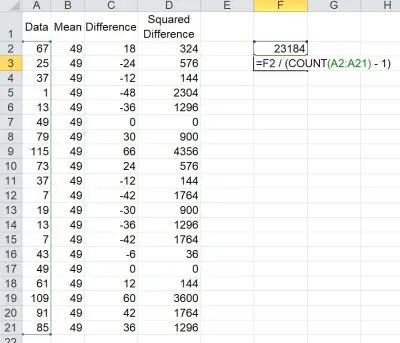
Now, we add up the squared differences. The formula is =SUM(D2:D21), and the sum is in cell F2.
Divide the sum in cell F2 by the sample size minus one (so 20 – 1 = 19). You can use the formula =COUNT(A2:A21) – 1 to find the number of data points in the list, minus 1.
Finally, take the square root of the quotient in cell F3, which gives us the sample standard deviation. The formula is =SQRT(F3).
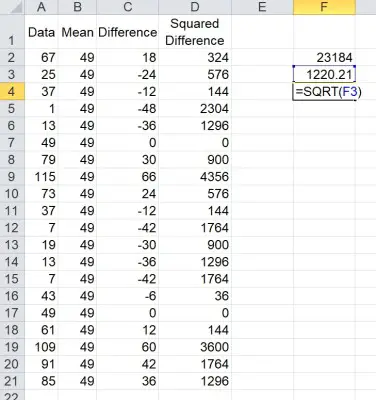
The sample standard deviation of 34.9315 matches the result we get from using the formula =STDEV.S(A2:A21).
Calculating Population Standard Deviation In Excel Without Formula (Manual Calculation)
To find the population standard deviation, the process is very similar to the one we used for finding samples standard deviation. Here are the steps:
- 1. Calculate the mean of the sample (add up all the values and divide by the number of values).
- 2. Calculate the difference between the sample mean and each data point.
- 3. Square the differences from Step 2.
- 4. Sum the squared differences from Step 3.
- 5. Divide the sum from Step 4 by N (the population size).
- 6. Take the square root of the quotient from Step 5.
As a reminder, the formula below gives the formula for the population standard deviation:
The calculation would work exactly the same as in the example above, but instead of dividing by n – 1 (sample size minus one), we divide by n (population size).
Conclusion
Now you know how to use Excel to calculate standard deviation and some different ways to do it. You also know the difference between sample and population standard deviation.
You can learn about the units for standard deviation here.
You can learn more about data literacy in my article here.
You can learn more about the difference between a parameter and a statistic in this article.
You can learn about the difference between standard deviation and standard error here.
You can also learn more about the difference between sample and population standard deviation in my article here.
You can learn more about how to interpret standard deviation here.
You can learn how to calculate the mode in Excel here.
I hope you found this article helpful. If so, please share it with someone who can use the information.
Don’t forget to subscribe to my YouTube channel & get updates on new math videos!
~Jonathon