
When we use statistics to analyze data, we often use mean (to find center) and standard deviation (to find spread). It is important to understand how standard deviation applies to data values that are percentages.
So, can standard deviation be a percentage? Standard deviation can be a percentage when the values in a data set are percentages. In that case, the mean is also a percentage. For example, we could calculate the percentage of rainy days each year – the mean and standard deviation for a data set with 50 years would both be percentages.
Of course, the mean and standard deviation for a data set always have the same units so that we can compare them in a way that makes sense (or create confidence intervals, for example).
In this article, we’ll talk about when standard deviation is a percentage and what it means. We’ll also look at some examples to make the concept clear.
Let’s get started.
Can Standard Deviation Be A Percentage?
Standard deviation can be a percentage in some cases. Whenever the values in a data set are percentages, the standard deviation will be a percentage. The mean is also a percentage in those cases.
Even when the mean and standard deviation are percentages, they are still telling us the same thing as usual:
- The mean is a measure of the center of the data
- The standard deviation is a measure of the spread of the data
A mean of 50% with a standard deviation of 1% means that most data is tightly clustered around the average of 50% (since a small standard deviation means less variation in the data values).
On the other hand, a mean of 50% with a standard deviation of 10% means that the data can be spread out quite far from the average of 50% (in a normal distribution, about 5% of the values will be below 30% or above 70%).
Here are some examples where the standard deviation is a percentage.
Example 1: Percentage Of Rainy Days In A Year
Let’s define a rainy day as one in which at least 1 inch of rain falls in a city. We can then find out how many rainy days there are in a given year in that city.
Then, we can divide the number of rainy days by the total number of days to get the percentage of rainy days in the year:
- (Percentage Of Rainy Days) = (Number Of Rainy Days In Year) / (Total Days In Year)
For example, let’s say that in 2020, there were 100 rainy days in a city. Since there were 365 days in that year, the percentage of rainy days would be 100/365 or about 27.4%.
Now, we could repeat this process for a number of years, going back as far as we want (or at least, as far back as we have enough data).
Let’s say that 20 years of data show the following:
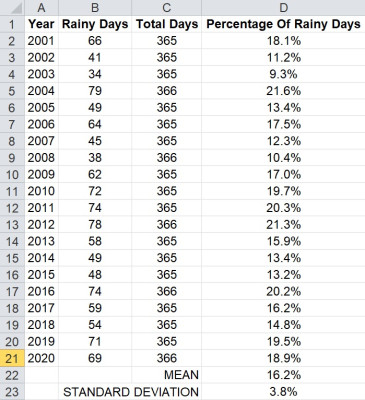
Calculating the mean of this data set (the average of column D, the percentage of rainy days), we get a value of 16.2%. The standard deviation ends up being 3.8%.
So, both the mean and standard deviation are percentages in this case. Specifically, the percentage of rainy days in each year.
Example 2: Percentage Of Investment Returns
When analyzing investments, it is sometimes helpful to look at ROI (return on investment) as a percentage, rather than in terms of dollars or other currencies.
That way, we can compare percentages across different investments (with different amounts invested) to get an idea of which investment performs better, on average.
Let’s say that we have two possible investments, along with 20 years of investment data, as shown below.
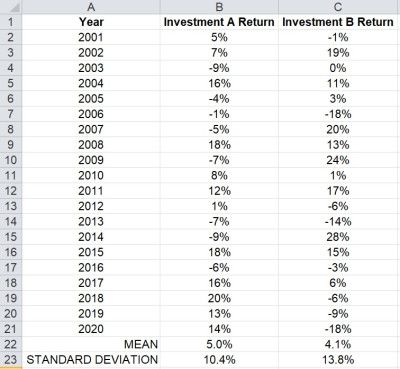
Calculating the mean of the first investment (the data set in column B, the returns for Investment A), we get a value of 5.0%. The standard deviation ends up being 10.4%.
Calculating the mean of the second investment (the data set in column C, the returns for Investment B), we get a value of 4.1%. The standard deviation ends up being 13.8%.
So, the average return for investment A is higher than that of Investment B. Not only that, but the standard deviation for Investment A is lower than for Investment B.
So, Investment A has a higher average return, with less variability in returns.
Conclusion
Now you know when standard deviation is a percentage and what it means.
You can learn how to interpret standard deviation here.
You can learn how to calculate standard deviation in Excel here.
I hope you found this article helpful. If so, please share it with someone who can use the information.

Don’t forget to subscribe to our YouTube channel & get updates on new math videos!