
In Excel, normal distributions help us to find the probability that a variable falls within a given range of values. The probability depends on the mean and standard deviation of the distribution.
So, how do you find normal distributions in Excel? To find a percentile for a normal distribution in Excel, use the NORM.DIST function. The first 3 inputs to this function are the variable value X, along with the mean M and standard deviation S of the normal distribution. Use “TRUE” as the 4th input to find percentiles for the normal distribution.
Of course, we can also use NORM.DIST with a FALSE argument as the fourth input to give us values from the PDF (probability density function), rather than the CDF (cumulative distribution function).
In this article, we’ll talk about how to find percentiles from a normal distribution in Excel. We’ll also look at some examples to make the concept clear.
Let’s get started.
Probability Of Normal Distributions In Excel
To find the probability for a given value of X for a normal distribution in Excel, we need to take a few steps:
- First, we need to make sure the data is normally distributed.
- Next, find the mean “M” of the data set. We can use the AVERAGE function in Excel to find the mean.
- Then, find the standard deviation “S” of the data set. We can use the STDEV.P function in Excel to find the standard deviation of a population.
- Finally, we use X, M, and S as the first 3 inputs to the NORM.DIST function, with TRUE as the fourth input.
You can see an example of how to do this below.
Example: Find A Probability For A Normal Distribution In Excel
Let’s say we have a normal distribution with a mean of M = 100 and a standard deviation of S = 15. We want to find the probability that the value of a data point is less than or equal to X = 130.
We would use the following formula in Excel:
- =NORM.DIST(130, 100, 15, TRUE)
You can see this illustrated below:
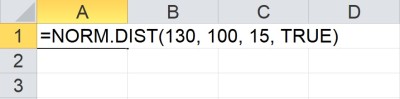
We get a value of 0.9772, which is 97.72% as a percentage. So, there is a 97.72% chance that the value of a data point in the distribution is less than or equal to 130.
In other words, 97.72% of the values in the distribution are less than or equal to 130.
On the other hand, 2.28% (100% – 97.72%) of the values in the distribution are greater than 130.
What Is Cumulative In A Normal Distribution In Excel?
Cumulative is the fourth input to the NORM.DIST function in Excel. The value of “cumulative” is either TRUE or FALSE, and this tells Excel which version of the NORM.DIST function to use:
- If “cumulative” is TRUE, then Excel uses the cumulative distribution function (CDF) of the normal distribution with the given mean and standard deviation.
- If “cumulative” is FALSE, then Excel uses the probability density function (PDF) of the normal distribution with the given mean and standard deviation.
Here is the way to remember the difference between the two functions:
- For a given input value of X, the output of the CDF is the percentage of values in a normal distribution (with mean M and standard deviation S) that are less than or equal to X.
- For a given input value of X, the output of the PDF is the “height” of the normal distribution (with mean M and standard deviation S) if we were to graph it.
In calculus terms, the CDF is the antiderivative of the PDF (or, the PDF is the derivative of the CDF).
In other words, we would find the area under the PDF to find a corresponding value of the CDF.
How To Find Standard Normal Distribution In Excel
There are two basic ways to find a percentile for a standard normal distribution in Excel.
The first way is to use the NORM.DIST function with an input of X as the first input, M = 0 for the mean, and S = 1 for the standard deviation (with TRUE as the fourth input). It would look like this:
- =NORM.DIST(X, 0, 1, TRUE)
The second way is to use the NORM.S.DIST function with Z as the first input and a value of TRUE as the second input. It would look like this:
- =NORM.S.DIST(Z, TRUE)
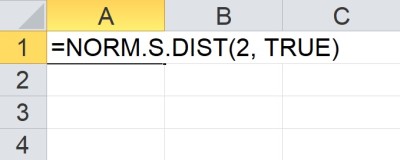
Remember that NORM.S.DIST is basically a special case of the NORM.DIST function where the mean is zero and the standard deviation is 1 (that is, the definition of a standard normal distribution).
When we deal with a standard normal distribution, the values are z-scores (z-values).
(You can learn more about how to find z scores in Excel here).
Let’s look at examples of how to do this with both functions in Excel.
Example 1: Find A Standard Normal Distribution In Excel Using NORM.DIST
Let’s say we want to find the percentile for a value of Z = 2 in a standard normal distribution with mean M = 0 and standard deviation S = 1.
We would use the following function in Excel:
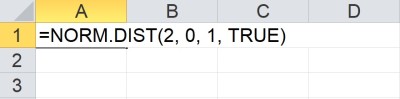
=NORM.DIST(2, 0, 1, TRUE)

We get a result of 0.9773 which means that 97.73% of the values in the distribution have a value less than or equal to 2.
Example 2: Find A Standard Normal Distribution In Excel Using NORM.S.DIST
Let’s say we want to find the percentile for a value of Z = 1.5 in a standard normal distribution (which has a mean M = 0 and standard deviation S = 1.
We would use the following function in Excel:
=NORM.S.DIST(1.5, TRUE)
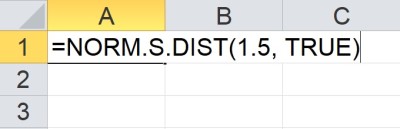
We get a result of 0.9332, which means that 93.32% of the values in the distribution have a value less than or equal to 1.5.
How To Find X In A Normal Distribution In Excel
To find the value of X for a given percentile (probability) in a normal distribution in Excel, we also need to know the mean and standard deviation.
We would use the NORM.INV function with three inputs:
- The first input is the percentile (percentage of values in the distribution that are less than or equal to X).
- The second input is M, the mean of the normal distribution.
- The third input is S, the standard deviation of the normal distribution.
It would look like this in Excel:
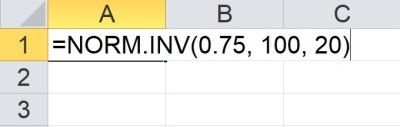
If we want to find a Z value for a given percentile for a standard normal distribution (with mean M = 0 and standard deviation S = 1), there are two ways to do it:
- =NORM.INV(percentile, 0, 1)
- =NORM.S.INV(percentile)
Let’s look at examples of how to do this with both functions in Excel.
Example 1: Find X In A Normal Distribution In Excel Using NORM.INV
Let’s say we want to find the value of X for the percentile 90% in a normal distribution with mean M = 200 and standard deviation S = 25.
We would use the following function in Excel:
=NORM.INV(0.9, 200, 25)
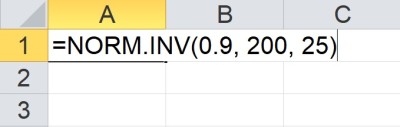
We get a result of 232.04, which means that 90% of the values in the distribution have a value less than or equal to 232.04.
Example 2: Find Z In A Standard Normal Distribution In Excel Using NORM.S.INV
Let’s say we want to find the value of Z for the percentile 70% in a standard normal distribution (which has mean M = 0 and standard deviation S = 1).
We would use the following function in Excel:
=NORM.S.INV(0.7)
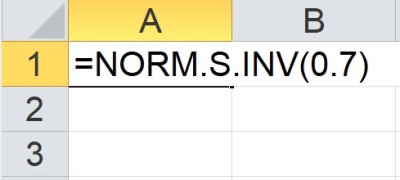
We get a result of 0.5244, which means that 70% of the values in the distribution have a value less than or equal to 0.5244.
How To Plot A Normal Distribution In Excel (Graphing The Normal Distribution)
Here are some steps you can take to plot a normal distribution in Excel:
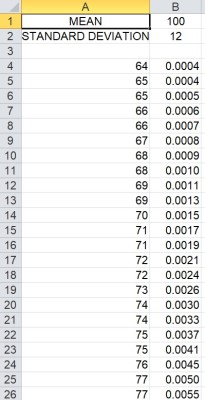
- First, make sure you know the mean M and standard deviation S. Put the mean in cell B1 and the standard deviation in cell B2.
- Next, calculate the value M – 3S in cell A4 (the formula is “=B1 – 3*B2”).
- Then, add 1/20 of the standard deviation to get the next value in cell A5 (the formula is “=A4 + $B$2/20).
- Now, copy down cells (you should get to a value of M + 3S in cell A124).
- Next, in cell B4, put the formula “=NORM.DIST(A4, $B$1, $B$2, FALSE)”. It is necessary to use “FALSE” as the fourth argument because we want to graph the PDF, not the CDF.
- Then, copy down cells from B4 to B124.
- Finally, select the range of cells A4:B124, and insert a scatter plot without points (a smooth curve).
You can format the axes as necessary to get the view that you want for your normal distribution.
You can see the graph below for a mean of M = 100 and a standard deviation of S = 12.
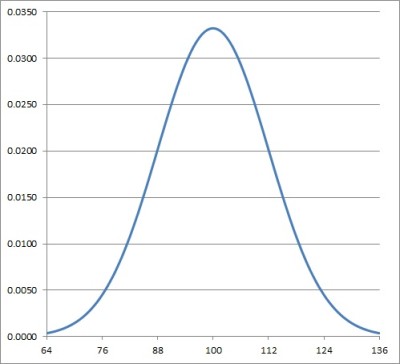
Note that if you want a normal distribution, just use a mean of M = 0 and a standard deviation of S = 1, with the same steps above.
Conclusion
Now you know how to find a percentile from a normal distribution in Excel. You also know how to find values from the PDF (probability density function) of a normal distribution.
You can learn more about how to find percentiles in Excel here.
You can learn how to interpret standard deviation here.
You can also learn about binomial distributions here.
I hope you found this article helpful. If so, please share it with someone who can use the information.

Don’t forget to subscribe to our YouTube channel & get updates on new math videos!