
Finding the mean (or average) of a set of values is used in many contexts, including business, finance, and research. Microsoft Excel can find the mean for any set of values you choose as input.
So, how do you find mean in Excel? To find mean in Excel, use the “AVERAGE” function. The input to the average function is a range of cells (you can enter one or more cells, rows, or columns, separating inputs with a comma). For example, the mean of the values in cells A1 to A20 would be given by the formula “=AVERAGE(A1:A20)”.
Of course, when dealing with the mean, remember that population mean takes into account every person or item in the entire group, while sample mean only uses a subset of the group.
In this article, we’ll talk about finding mean in Excel, including how to do it, alternative methods, and when you might use it. We’ll also look at some other types of mean, including geometric mean, harmonic mean, and weighted averages.
Let’s get started.
How To Find Mean In Excel (The Average Function In Excel)
The easiest way to find the mean (also called arithmetic mean) in Excel is to use the “AVERAGE” function. This function can take one or more inputs, separated by commas.
Each input is one or more cells – an input can be:
- a single cell (for example, “A1” would be a single cell)
- a row (for example, “A1:J1” would be a row consisting of 10 cells)
- a column (for example, “A1:A8” would be a column consisting of 8 cells)
- a block of cells (for example, “A1:J8” would be a block of cells consisting of 8 rows and 10 columns, for a total of 8*10 = 80 cells)
- a named range (for example “my_values”, which could denote any set of cells you choose, including an individual cell, a row, a column, or a block of cells)
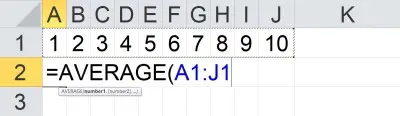
For example, the mean of the values in cells A1 to J1 (a row of 10 cells) would be given by the formula
- =AVERAGE(A1:J1)
You can see an example of this illustrated below.
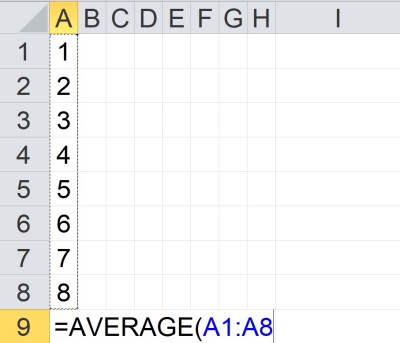
The mean of the values in cells A1 to A8 (a column of 8 cells) would be given by the formula
- =AVERAGE(A1:A8)
You can see an example of this illustrated below.
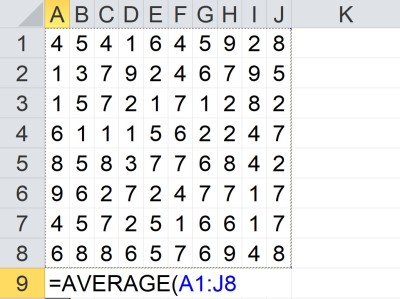
The mean of the values in cells A1 to J8 (a block of 80 cells) would be given by the formula
- =AVERAGE(A1:J8)
You can see an example of this illustrated below.
The mean of the value in cells A1 to A5 and C1 to C5 would be given by the formula
- =AVERAGE(A1:A5, C1:C5)
You can see an example of this illustrated below.
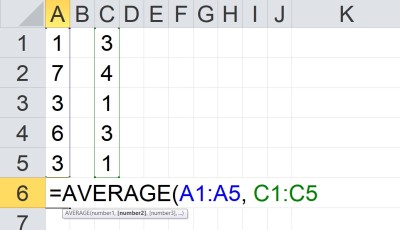
Note that the two inputs (A1:A5 and C1:C5) are separated by a comma. Each input has a total of 5 cells, for a total of 10 cells as input.
Also note that we can take the average of any combination of cells, rows, columns, and blocks.
Alternative To Average In Excel
One alternative to the AVERAGE function in Excel is to combine the SUM and COUNT functions, along with division (denoted by the “/” symbol).
Remember that the mean (average or arithmetic mean) for a set of n values {x1, x2, … , xn} is given by the formula:
- Mean = (x1 + x2 + … + xn) / n
or, as an Excel formula for n = 10:
- =SUM(A1:A10) / COUNT(A1:A10)
The above formula will return the same result as
- =AVERAGE(A1:A10)
The alternative method is useful in some cases when you might like to show the sum, the count, and the mean that comes from dividing the sum by the count.
Example: Alternative To Average In Excel
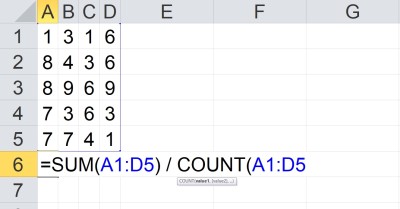
Let’s say we want to find the mean of the set of values in the cells A1:D5 in Excel. Instead of using the AVERAGE function, we can divide the SUM function by the COUNT function as follows:
- =SUM(A1:D5) / COUNT(A1:D5)
You can see an example of this illustrated below.
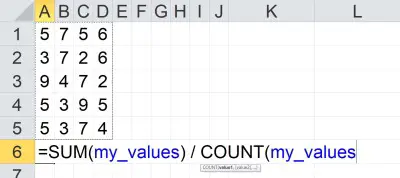
Note that you can also use a named range to make it easier to change inputs later. For example, if you create a named range called “my_values” and define it to be cells A1:D5, you can use the formula:
- =SUM(my_values) / COUNT(my_values)
You can see an example of this illustrated below.
If you change the definition of the named range my_values to cells A1:E5, the sum and count will be updated to reflect the new input range (as will the average).
Is Average The Same As Mean In Excel? (Difference Between Mean & Average)
In Excel, average is the same as mean. That is, there is no difference between mean and average in Excel.
However, there are different types of means that we can use. For example, there is geometric mean and also harmonic mean (we will look at both of these later).
There is also a weighted average, which assigns different weight to each value. The arithmetic mean (or mean, or average) assigns equal weight to each value.
When To Use Average In Excel
The average (or mean) is a measure of center in a data set. So, you might use an average in Excel to tell you where the center of a data set lies.

(You can learn more about uses of mean in this article).
You can also use median or mode as alternative measures of center for a data set. You can learn more about the differences between mean and median here.
Another way to use average in Excel is to track the performance of a group or to compare multiple groups, based on a data set from each group. For example, you could track the average revenue per month, quarter, or year for one or more groups of salespeople at a company.
How To Calculate Geometric Mean In Excel
Remember that the geometric mean for a set of n values {x1, x2, … , xn} is given by the formula:
- Geometric Mean = n√(x1*x2*…*xn)
In other words, the geometric mean of a set of n values is the principal nth root of the product of those n numbers.
The easiest way to find the geometric mean in Excel is to use the “GEOMEAN” function. This function can take one or more inputs, separated by commas.
Each input is one or more cells – an input can be:
- a single cell (for example, “A1” would be a single cell)
- a row (for example, “A1:J1” would be a row consisting of 10 cells)
- a column (for example, “A1:A8” would be a column consisting of 8 cells)
- a block of cells (for example, “A1:J8” would be a block of cells consisting of 8 rows and 10 columns, for a total of 8*10 = 80 cells)
- a named range (for example “my_values”, which could denote any set of cells you choose, including an individual cell, a row, a column, or a block of cells)
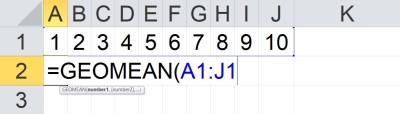
For example, the geometric mean of the values in cells A1 to J1 (a row of 10 cells) would be given by the formula
- =GEOMEAN(A1:J1)
You can see an example of this illustrated below.
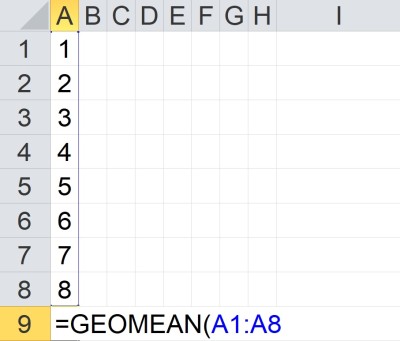
The geometric mean of the values in cells A1 to A8 (a column of 8 cells) would be given by the formula
- =GEOMEAN(A1:A8)
You can see an example of this illustrated below.
How To Calculate Harmonic Mean In Excel
Remember that the harmonic mean for a set of n values {x1, x2, … , xn} is given by the formula:
- Harmonic Mean = n / (x1-1 + x2-1 … + xn-1)
In other words, to find the harmonic mean of a set of n values, we take these steps:
- Step 1: Find the reciprocal (inverse) of each of the n values in the set of numbers (so x1-1 = 1/x1, x2-1 = 1/x2, etc.)
- Step 2: take the sum of the n reciprocals from Step 1 (calculate x1-1 + x2-1 … + xn-1).
- Step 3: take the reciprocal of the sum from Step 2 (calculate 1 / (x1-1 + x2-1 … + xn-1)).
- Step 4: multiply the result of Step 3 by n (calculate n / (x1-1 + x2-1 … + xn-1)).
The easiest way to find the geometric mean in Excel is to use the “HARMEAN” function. This function can take one or more inputs, separated by commas.
Each input is one or more cells – an input can be:
- a single cell (for example, “A1” would be a single cell)
- a row (for example, “A1:J1” would be a row consisting of 10 cells)
- a column (for example, “A1:A8” would be a column consisting of 8 cells)
- a block of cells (for example, “A1:J8” would be a block of cells consisting of 8 rows and 10 columns, for a total of 8*10 = 80 cells)
- a named range (for example “my_values”, which could denote any set of cells you choose, including an individual cell, a row, a column, or a block of cells)
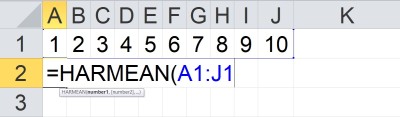
For example, the harmonic mean of the values in cells A1 to J1 (a row of 10 cells) would be given by the formula
- =HARMEAN(A1:J1)
You can see an example of this illustrated below.
The harmonic mean of the values in cells A1 to A8 (a column of 8 cells) would be given by the formula
- =HARMEAN(A1:A8)
You can see an example of this illustrated below.

How To Calculate Weighted Average In Excel (Weighted Mean)
The easiest way to calculate weighted average (weighted mean) in Excel is to use the SUMPRODUCT formula. The first input is the set of values, and the second input is the set of weights.
Note that the values and weights should correspond. If they do not, you will be assigning the wrong weights to each value.
Also, the weights should add up to 1 (100%).
Example: Weighted Average In Excel
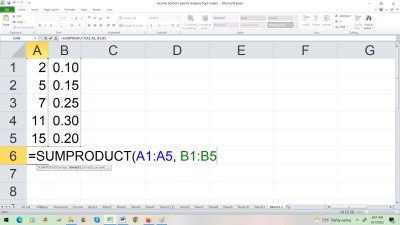
Let’s say we want to take a weighted average of 5 values in Excel. The table below gives the values and the weights:
| Values | Weights |
|---|---|
| 2 | 0.1 |
| 5 | 0.15 |
| 7 | 0.25 |
| 11 | 0.3 |
| 15 | 0.2 |
In Excel, we would put the numbers from column 1 in the table (values) into cells A1:A5. Then, we would put the numbers from column 2 in the table (weights) into cells B1:B5.

Finally, we would use the SUMPRODUCT formula to multiply each value in the first column by its corresponding weight in the second column, and then add up the products.
The formula would be:
- =SUMPRODUCT(A1:A5, B1:B5)
You can see a picture of this below.
Conclusion
Now you know how to find mean in Excel, as well as an alternative method to find the mean in Excel and how to use named ranges. You also know how to find other types of means and weighted averages in Excel.
You can learn more about what mean tells you about data (along with lots of examples) here.
You can learn how to calculate median in Excel here.
You can learn how to calculate the mode in Excel here.
You can learn about the differences between mean and standard deviation here.
I hope you found this article helpful. If so, please share it with someone who can use the information.

Don’t forget to subscribe to our YouTube channel & get updates on new math videos!