
Finding the percentile for a number in a data set helps us to get a sense of where the number falls in the distribution. Microsoft Excel can find a given percentile for any set of values you choose as input.
So, how do you find percentiles in Excel? To find percentile in Excel, use the PERCENTILE function. The inputs for this function are an array of cells (row, column, or block) and a percentile (between 0 and 1). For example, the formula “=PERCENTILE(A1:A8, 0.9)” gives the 90th percentile of the values in cells A1 to A8.
Of course, we can also mark percentiles on the graph of a data set to show 90th percentile, 80th percentile, etc.
In this article, we’ll talk about how to find percentiles in Excel. We’ll also look at some examples to make the concept clear.
Let’s get started.
How To Find Percentile In Excel
The easiest way to find a percentile in Excel is to use the “PERCENTILE” function. This function takes two inputs, separated by commas.

As an example, the Excel percentile formula looks like this:
- =PERCENTILE(A1:A8, 0.4)
The first input is an array of cells, which can be:
- a row (for example, “A1:J1” would be a row consisting of 10 cells)
- a column (for example, “A1:A8” would be a column consisting of 8 cells)
- a block of cells (for example, “A1:J8” would be a block of cells consisting of 8 rows and 10 columns, for a total of 8*10 = 80 cells)
- a named range (for example “my_values”, which could denote any set of cells you choose, including a row, a column, or a block of cells)
The second input is the percentile. This input is a decimal value between 0 and 1 that tells Excel which percentile to find.
Some common percentiles are as follows:
- 0 gives the minimum of the data set (0th percentile)
- 0.25 gives the 25th percentile of the data set, also known as Q1 (the first quartile, lower quartile, or bottom quartile of the data set).
- 0.5 gives the 50th percentile of the data set, also known as Q2 or the median (the lower half or bottom half of the data set).
- 0.75 gives the 75th percentile of the data set, also known as Q3 (the third quartile, upper quartile, or top quartile of the data set).
- 1 gives the maximum of the data set (99th percentile)
(You can learn more about percentile, what it means, and how to interpret it here).
For example, here are some formulas for percentiles:
- The 0th percentile or minimum (Q0) of the values in cells A1 to A8 (a column of 8 cells) would be given by the formula “=PERCENTILE(A1:A8, 0)
- The 25th percentile or first quartile (Q1) of the values in cells A1 to A8 (a column of 8 cells) would be given by the formula “=PERCENTILE(A1:A8, 0.25). Note that the function =QUARTILE(A1:A8, 1) would also work, giving the same result.
- The 50th percentile or second quartile (Q2 or median) of the values in cells A1 to A8 (a column of 8 cells) would be given by the formula “=PERCENTILE(A1:A8, 0.5). Note that the function =MEDIAN(A1:A8) would also work, giving the same result.
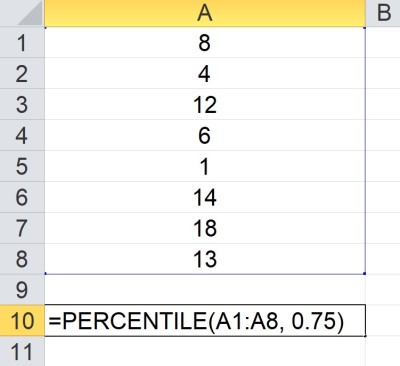
- The 75th percentile or third quartile (Q3) of the values in cells A1 to A8 (a column of 8 cells) would be given by the formula “=PERCENTILE(A1:A8, 0.75). Note that the function =QUARTILE(A1:A8, 3) would also work, giving the same result.
- The 99th percentile or maximum (Q4) of the values in cells A1 to A8 (a column of 8 cells) would be given by the formula “=PERCENTILE(A1:A8, 1)
You can see an example for the 75th percentile illustrated below.
How To Calculate 25th Percentile In Excel
To find the 25th percentile in Excel, we use the PERCENTILE formula with two inputs:
- The first input is the array containing the values in the data set.
- The second input is 0.25.
So the formula looks like this:
- =PERCENTILE(my_values, 0.25)
where my_values is an array (row, column, or block of cells).
Note that the 25th percentile is the median of the bottom 50% of the data set (between the minimum and median, or Q0 and Q2).
Let’s look at an example to see how it works in Excel.
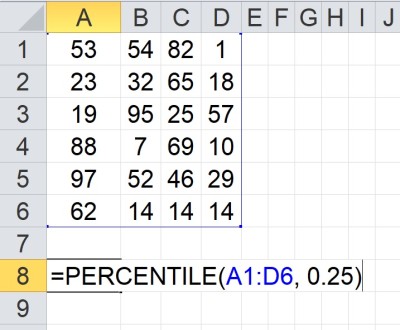
Example: How To Find 25th Percentile In Excel
Let’s say we want to find the 25th percentile of the data in cells A1:D6 (24 values).
We would use the formula
- =PERCENTILE(A1:D6, 0.25)
You can see this illustrated in Excel below.
How To Calculate 90th Percentile In Excel
To find the 90th percentile in Excel, we use the PERCENTILE formula with two inputs:
- The first input is the array containing the values in the data set.
- The second input is 0.9.
So the formula looks like this:
- =PERCENTILE(my_values, 0.9)
where my_values is an array (row, column, or block of cells).
Note that at least 90% of the values are below the 90th percentile of the data set. In other words, the 90th percentile tells you what it takes to be in the top 10%.
Let’s look at an example to see how it works in Excel.
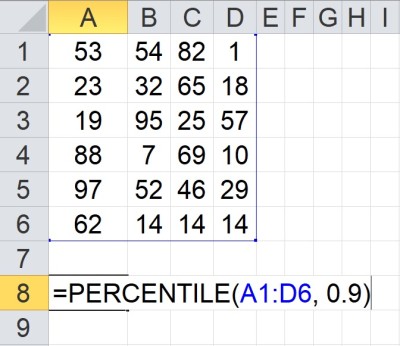
Example: How To Find 90th Percentile In Excel
Let’s say we want to find the 90th percentile of the data in cells A1:D6 (24 values).
We would use the formula
- =PERCENTILE(A1:D6, 0.9)
You can see this illustrated in Excel below.
How To Calculate 75th Percentile In Excel
To find the 75th percentile in Excel, we use the PERCENTILE formula with two inputs:
- The first input is the array containing the values in the data set.
- The second input is 0.75.
So the formula looks like this:
- =PERCENTILE(my_values, 0.75)
where my_values is an array (row, column, or block of cells).
Note that the 75th percentile is the median of the top 50% of the data set (between the median and maximum, or Q2 and Q4).
Let’s look at an example to see how it works in Excel.
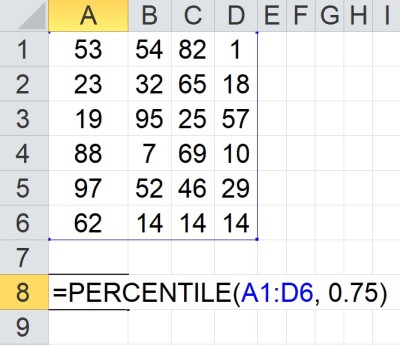
Example: How To Find 75th Percentile In Excel
Let’s say we want to find the 75th percentile of the data in cells A1:D6 (24 values).
We would use the formula
- =PERCENTILE(A1:D6, 0.75)
You can see this illustrated in Excel below.
How Is Percentile Calculated In Excel?
Excel calculates percentiles using two things:
- a count of the total number of values in the data set
- a sorted list of values in the data set (from smallest to largest)
For example, let’s say we have an array of values in the named range “my_values” in Excel. If we enter the formula “PERCENTILE(my_values, 35), here is what happens:
- First, Excel does a count to find that there are 100 values in the array (in other words, my_values is a range with 100 cells).
- Next, Excel sorts the values into an ordered list (from smallest to largest).
- Then, Excel takes the percentile input of 35 and counts to the 35th value in the ordered list.
- Finally, Excel returns the value in the 35th position in the ordered list.
Note that for some data sets and percentiles, Excel will have to interpolate. Specifically, for a data set with n values, if the percentile (2nd input) is not a multiple of 1/(n – 1), then the PERCENTILE function interpolates to find a value for that percentile.
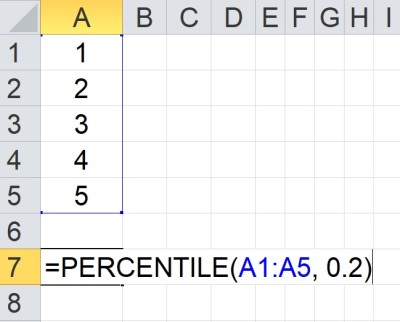
For example, in Excel, the 20th percentile of the data set {1, 2, 3, 4, 5} would be 1.8. The reasoning is:
- There are 5 values in the data set, so n = 5 and n – 1 = 4.
- The percentile, 0.2, is not a multiple of 1/(n – 1) = 1/4 = 0.25. So, Excel interpolates.
- The 0th percentile is 1
- The 25th percentile is 2
- The 20th percentile is 80% of the way from the 0th percentile to the 25th percentile (20/25 = 0.8).
- 1.8 is 80% of the way from 1 to 2.
What Does Percentile In Excel Mean?
Remember that percentiles help us to split data into groups.
For example:
- the 50th percentile (median or Q2) helps us to tell where the “middle” of a data set lies.
- the 25th percentile (Q1) helps us to tell where the “middle” of the bottom half of the data set lies.
- the 75th percentile (Q3) helps us to tell where the “middle” of the top half of the data set lies.
Percentiles are a good way to split a group into subcategories. For example:
- You can split salespeople into groups based on sales volume or revenue, such as quartiles (4 groups of 25% each), quintiles (5 groups of 20% each), deciles (10 groups of 10% each), etc.
- You can split city residents into groups based on annual income, home values, etc.
- You can see where a given day, season, or year falls in terms of historical temperature (bottom 20% for the past decade, top 10% in the last century, etc.)
- You can split a population into percentiles based on health measures such as height, weight, etc.
How To Find Percentile In Excel With Mean & Standard Deviation
Assuming that you have a normal distribution with mean M and standard deviation S, along with a value X, you would use the following formula to find the percentile of X:
- =NORM.DIST(X, M, S, TRUE)
The first argument is the value in the distribution that you want to find a percentile for.
The second argument is the mean, M, of the distribution.
The third argument is the standard deviation, S, of the distribution.
The fourth argument is TRUE (since we want a cumulative value for the distribution).
Let’s look at an example.
Example: Find Percentile In Excel With Mean & Standard Deviation (Normal Distribution)
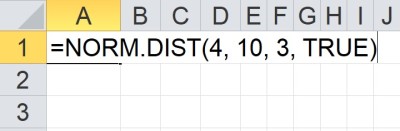
Let’s say you have a normal distribution with a mean of 10 (M = 10) and a standard deviation of 3 S = 3).
You want to find the percentile for a value of 4 (X = 4).
We would use the following formula in Excel:
- =NORM.DIST(4, 10, 3, TRUE)
This gives a value of 0.02275, or 2.275th percentile.
Assuming we want the value for a given percentile, we can use the NORM.INV function instead. That is, instead of converting a value to a percentile, we can convert a percentile to a value.
Assuming that you have a normal distribution with mean M and standard deviation S, along with a value X, you would use the following Excel formula to find the percentile of X:
- =NORM.INV(R, M, S)
The first argument is the percentile (rank), R, in the distribution that you want to find a value for.
The second argument is the mean, M, of the distribution.
The third argument is the standard deviation, S, of the distribution.
Let’s look at an example.
Example: Find Percentile In Excel With Mean & Standard Deviation (Normal Distribution)
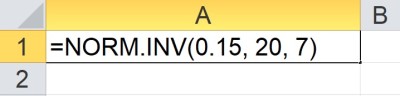
Let’s say you have a normal distribution with a mean of 20 (M = 20) and a standard deviation of 7 S = 7).
You want to find the value that corresponds to the 15th percentile (R = 0.15).
We would use the following formula in Excel:
- =NORM.INV(0.15, 20, 7)
This gives a value of 12.745 for the 20th percentile.
Excel Percentile Errors
- If the percentile (2nd input) is not a number, then Excel returns the #VALUE! error.
- If the percentile is less than 0 (negative) or greater than 1 (more than 100%), Excel returns the #NUM! error.
- If the percentile is not a multiple of 1/(n – 1) (n is the number of values in the data set), then the function interpolates to estimate a value.
The last bullet point above is something to investigate if PERCENTILE returns a value (rather than an error), but it is not the value you are expecting.
Conclusion
Now you know how to find percentiles in Excel, what they mean, and what they can tell you about a data set.
You can learn how to calculate percentages in Excel here.
You can learn about how to work with normal distributions in Excel here.
You can learn how to find mean in Excel here.
You can learn how to find median in Excel here.
You can learn how to find mode in Excel here.
I hope you found this article helpful. If so, please share it with someone who can use the information.

Don’t forget to subscribe to our YouTube channel & get updates on new math videos!