
A parameter tells us about an entire population – for example, population mean is a parameter. However, we cannot always poll the entire population, which is where a statistic comes in.
So, what is the difference between a parameter and a statistic? A parameter is a number that describes an entire population (it is calculated by taking every member of the population into account). A statistic is a number that is calculated from a sample (a subset of the population). A statistic estimates a parameter when we cannot poll an entire population.
Of course, when estimating a population parameter from a sample, a larger sample is better (as long as we are using a representative sample). Taking a sample of only a few data points from the population will not tell us much.
In this article, we’ll talk about the difference between a statistic and a parameter. We’ll also look at some examples to see how the two differ.
Let’s get started.
What Is The Difference Between A Parameter & A Statistic?
The main differences between a statistic and a parameter are:
- a statistic is a number that is based on a sample (subset) of the population, while a parameter is a number that takes into account every member of the population.
- a parameter cannot be “wrong”, since it takes all data points into account, while a statistic can vary from sample to sample and may differ from the true value of the parameter (a statistic is often used as an estimate for the population parameter).
- when calculating a statistic, the sample size n will affect our error in estimating the parameter, but when calculating a parameter, there is no error.

The table below summarizes the difference a statistic and a parameter.
| Statistic | Parameter |
|---|---|
| based on a subset of the population | based on the entire population |
| gives you an estimate of a parameter | gives you the exact value of parameter |
| changes with the sample | does not change with the sample |
| error in the estimate is based on the sample size | there is no error, since the parameter is exact |
between a statistic and a parameter.
Example: Statistic (Sample Mean) & Parameter (Population Mean)
Let’s say that we have a city with a population of 1 million people. If we want to find the average (mean) age parameter of people in the city, we would need to:
- ask all 1 million people their age (and hopefully get honest answers!)
- sum up all 1 million ages
- divide by 1 million (the population size)
This would give us an exact value, but it would be impractical to poll all 1 million people in the city (the cost in time and money would be prohibitive).

However, it would be much more reasonable to take a sample of 1,000 citizens, ask their ages, and find the average to get a statistic to estimate the mean age.
In this case, we would have to:
- choose a sample of 1,000 people (hopefully a representative sample that is not biased towards young or old)
- ask our entire sample of 1,000 people their age (and hopefully get honest answers!)
- sum up all 1,000 ages
- divide by 1,000 (the sample size)
Once we have the average age of the sample (our statistic), we would use this statistic to estimate the parameter. It could be off by a bit, but the large sample size means that we won’t be too far off (as long as the sample was not biased).
What Is Parameter Estimation?
Parameter estimation is when we use a statistic (calculated from a sample from the population) to get an estimate for a parameter (which is normally calculated by using data from the entire population).
Remember: it is not always practical to poll an entire population. It can also be difficult to get accurate data for a large population, which presents a challenge when trying to find a parameter.
A solution is to take a sample of the population that is large enough to make inferences about the entire population. Then, we can use the statistic that we calculated from the sample to make an estimate of the parameter.

To avoid bias, we should take a representative sample of the population. For example, if the population of interest is “all U.S. citizens”, then we should not use a sample of women aged 35 to 45 from the state of California.
Instead, we should try to find people of all ages from every state for our sample. The larger the sample size “n”, the better, since the sample statistic will approach the value of the population parameter as n gets larger.
Is A Statistic Used To Estimate A Parameter?
A statistic is used to estimate a parameter when we do not have access to data from the entire population.

As mentioned earlier, this lack of data on the entire population could be due to several reasons, including:
- Impracticality – it may not be practical to poll the entire population if there are millions of data points to collect. The time and money required to get data on every population member would be prohibitive.
- Refusal to participate – in some cases, people will refuse to answer a poll, even if you are able to reach them. They may value their privacy, or they may not have time to answer the poll.
Is A Statistic A Random Variable?
A statistic is a random variable that is a function of the data from a sample of the population. Note that the sample is also a random variable, since it can vary depending on how we take our sample, when we take our sample, where we take our sample, etc.
As we take a larger sample from the population, the variability of the parameter estimate decreases (since we are taking more of the data from the population into account by using a larger sample).

To use two extreme examples:
- if we take a sample size of just one person from a population of millions to estimate the mean height, there can be a huge variation in the calculated sample mean (perhaps from 4 feet to 8 feet).
- if we take a sample size of all but one person in the population (N – 1), then the calculated sample mean will be very close to the true population mean (since one person out of millions will not have a large impact on the mean).
Does A Parameter Ever Change?
A parameter can only change if the population changes in some way. For example, let’s say that our parameter is the average age of all the people in a small town.
If the oldest person in the town dies, then the population size decreases by 1, and the average age will decrease slightly. Similarly, if a new baby is born in town, then the population size increases by 1, and the average age will decrease slightly.
Of course, if nobody is born or dies in the town over the course of the next year, and nobody moves in or out of the town over the next year, then the average age will increase by 1 (since everyone is now 1 year older).

The key thing to remember is that changing the sample size or sampling method does not change the value of the parameter. Whether I sample 10, 100, or 1000 people, the average height of the people in a city of 1 million does not change.
Here is another way to think about it: no matter how I choose to estimate the number of marbles in a jar (by volume of the jar divide by volume of a marble, or by number of layers times marbles per layer, etc.), the actual number of marbles in the jar does not change.
In other words, my guess about the true number does not change the true number.
Sampling Distribution
When we estimate a parameter with a statistic calculated from a sample, a key idea is the sampling distribution.
The sampling distribution is the probability distribution of a statistic calculated with a random sample from the population.
If you were to take a large number of different samples from a population and calculate a statistic for each sample, the result would give you your sampling distribution.
For example, if you calculated the mean height for 5 samples of 100 people from a city of 1 million, you might get sample means of 69.5 inches, 70.3 inches, 70.4 inches, 70.9 inches, and 71 inches.
Given enough of these sample statistics, you could graph a sampling distribution, which might look something like the one below.
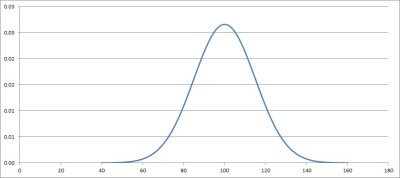
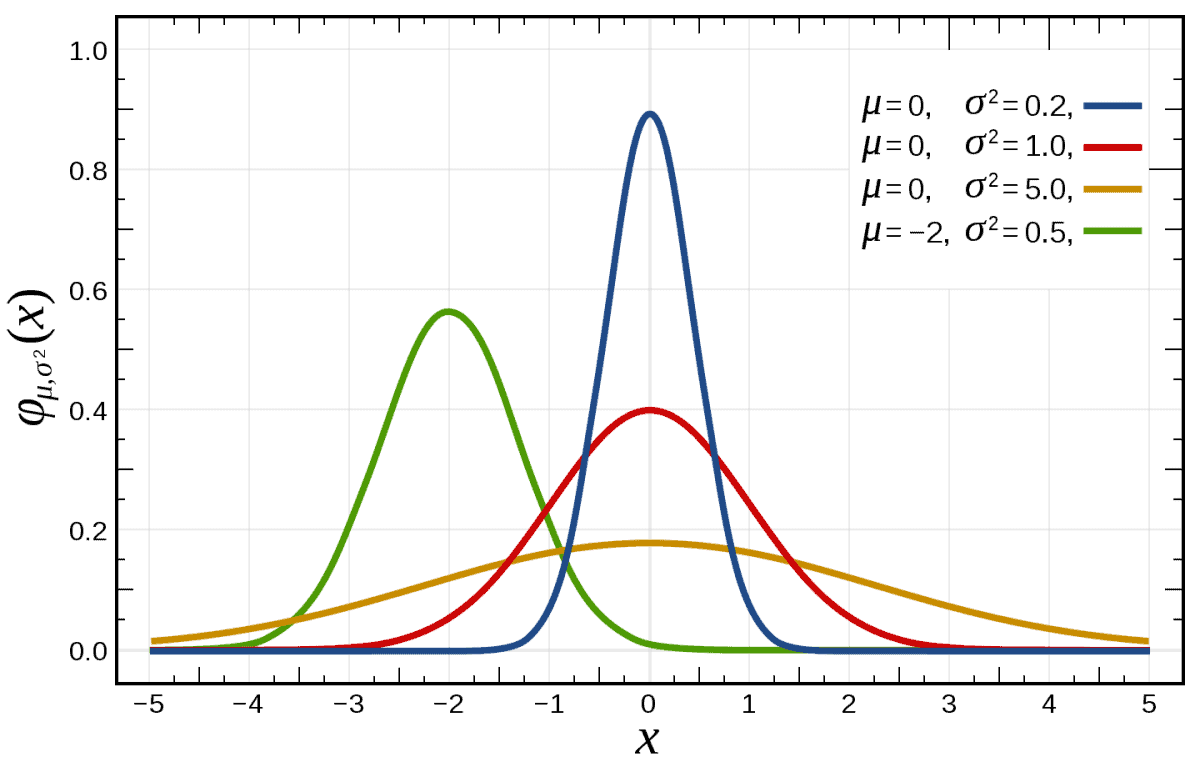
Note that the graph above looks like a bell curve, or a normal distribution curve.
Why Is The Sampling Distribution Approximately Normal?
The sampling distribution is approximately normal because the sample size is “large enough”. With a larger sample size, the sampling distribution gets closer to a normal distribution.
This is a consequence of the Central Limit Theorem, which states that the sum of independent random variables tends towards a normal distribution – even when the individual random variables are not normal.
One way to see this is with dice rolling and sums.
Example: Central Limit Theorem & Normal Distribution For Dice Rolling Sums
When we add up the faces on multiple dice and divide by the number of dice, the result approaches a normal distribution – with the same mean as for rolling one die, but with much less variation (smaller standard deviation).
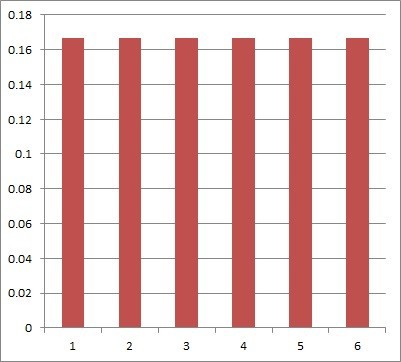
For just one fair six-sided die, we get a uniform distribution: there is a 1/6 chance of rolling each of the numbers 1 through 6.
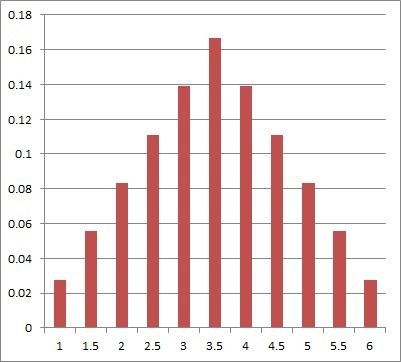
For the average of two fair six-sided dice, we get a distribution that is not uniform anymore. The table below shows the possible outcomes of rolling two dice.
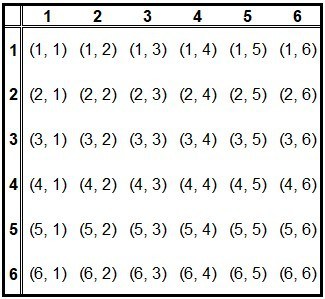
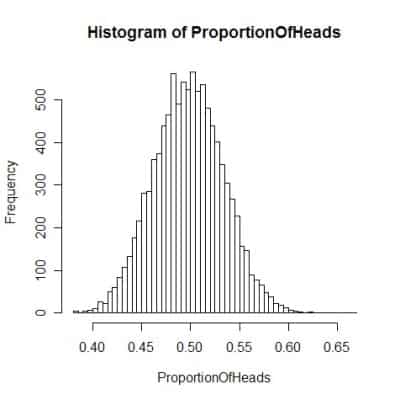
However, the graph of the average of two dice is starting to look more like a normal distribution:
For the average of three fair six-sided dice, we get a graph that looks even more like a normal distribution:
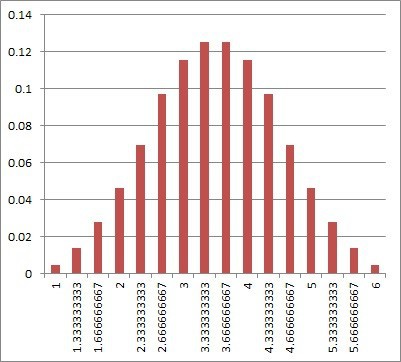
As we increase the number of dice, the distribution approaches a normal distribution. Its mean is still 3.5 (the same as for a single die), but the standard deviation becomes smaller.
This is because when we roll lots of dice, it is more likely that some small die rolls (1 and 2) will be offset by some large die rolls (5 and 6).
Conclusion
Now you know the difference between a statistic and a parameter. You also know when to use each one and how to calculate them.
I hope you found this article helpful. If so, please share it with someone who can use the information.
Don’t forget to subscribe to my YouTube channel & get updates on new math videos!
~Jonathon