
Individuals, companies, and governments are producing more data than ever before. In this age of “big data”, it is more important than ever to have the skills to put this data to use (known as data literacy).
So, what is data literacy? Having data literacy means you can understand & communicate with data. Basic data literacy means you can read, write, & analyze data. Advanced data literacy means visualizing data and presenting insights gained from data analysis. It also helps to know how data is collected, organized, and cleaned.
Of course, the level of data literacy you need will depend on your job and company. A technical role at a data-driven company will require a high level of data literacy.
In this article, we’ll talk about data literacy, what it is, and why it is important, along with some examples. We’ll also look at how you can develop data literacy and how it can help your career.
Let’s get started.
What Is Data Literacy?
Data literacy is the ability to understand data and what it is telling you. Data literacy also involves communicating with others or collecting, cleaning, analyzing, and visualizing data.
You can also think of data literacy in two parts:
- Producing – collecting, organizing, cleaning, analyzing, & presenting. This part is the “work” (planting the seeds).
- Consuming – reading and writing reports, plugging data into models, & applying insights to make better decisions. This part is the “payoff” (harvesting the crops).

Another important aspect of data literacy is being able to find mistakes in the data or to tell when data presentation is misleading (often called the “sniff test”).
Basically, you are using what you already know to decide if the data or conclusions make sense.
For example:
- Does it make sense if a presentation claims that the state of Massachusetts has a population of 7 billion? (No – there are less than 8 billion people on Earth. The population of Massachusetts is more like 7 million).
- Does it make sense that a company selling 50,000 printers per year reports a profit of $1,000,000? (Yes – this is a profit of $1,000,000 / 50,000 = $20 per printer, and printers often cost $200 or more, so a profit margin of 10% or lower is certainly possible).

It is also important to understand the progression and evolution of data. Roughly speaking, the progression is as follows:
- raw data–>clean data–>information–>knowledge–>insight–>wisdom–>decision making
To improve your data literacy, you should develop a basic understanding of what is involved in each of the above steps.
For example, how is raw data collected? Is it collected by a survey conducted by scientists? Does it come from an online form filled out by website visitors?
How is the data cleaned and organized? Is it done manually, or is there some type of automated process that fixes common errors and fills in missing data?
How is the data converted into information? Common technical skills include working with Excel, Access, SQL, and other database management solutions.
(For example, you can use Excel to calculate mean – you can learn more here.)
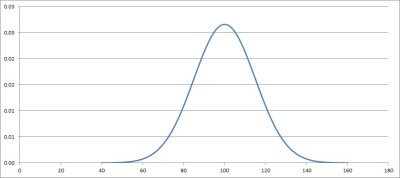
Common statistical measures include measures of center (such as mean, median, or mode) and measures of dispersion (such as standard deviation, range, or interquartile range).
(You can learn how to find quartiles in Excel here).
At a higher level, it is important to understand how decision makers understand their data to develop insight and gain wisdom to help choose the right direction for the organization.
You can learn more about how statistics is used in business here, and how statistics is used in everyday life here.
Examples Of Data Literacy
Data literacy is important in many contexts, including:
- Business
- Education
- Medicine
- Psychology
Example 1: Data Literacy In Business
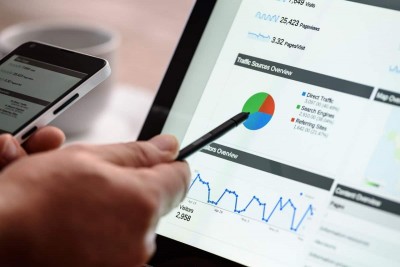
Many businesses now operate a website (in some cases, the website is most or all of the business!). Websites can educate visitors, generate leads, or take customer orders.
Knowing who is visiting the site and why (visitor demographics and user intent) can help a company to tailor its approach to better serve their customers.
Tools like Google Analytics, Google Search Console, and various other tools can help a business to understand which website pages drive traffic.

These tools can also reveal what customers are searching for and where they are coming from. For example, you can see whether customers find your page via organic search from a search engine like Google, or if they come from a social media platform (such as Facebook or LinkedIn).
Understanding where this data comes from and how to analyze it can help your business to grow. It can also help you to focus your efforts on what is already working best.
Example 2: Data Literacy In Education
Software is becoming more prevalent in the world of education. We can see this everywhere, from LMS (learning management systems) to attendance management solutions.
However, all of this data will not be useful to educators and administrators unless they have data literacy. Knowing where data comes from and what to do with it can help to improve outcomes for students.

For example, you can use an LMS to see where students who drop a course tend to stop doing the work. Maybe there is a particular unit that confuses and discourages students.
You could then investigate ways to improve the presentation of the material in that unit to make it more approachable. You might also break the unit into separate parts or devote more time to it during the semester.
You could also use data on attendance to determine how being present in class correlates with grades and overall performance.
Why Is Data Literacy Important?
Data literacy is important for several reasons:
- Data literacy helps you to understand how your data is being used, either for your benefit or for the benefit of others. For example, cookies track website visitors and are a privacy concern in some cases. However, they also allow for targeted advertising, which reduces customer acquisition cost for businesses, which in turn lowers prices for consumers.
- Data literacy gives you a sense of how numbers and statistics can be misleading. Knowing how data is collected (and whether collection was biased) can help you to avoid being fooled by news media, companies, or governments.
- Data literacy can give you an edge in your career. More data is being created now than ever before, so it is important to know how it is collected, analyzed, and used.
How Does Data Literacy Advance Your Career?
Data literacy is the first step in helping your organization to improve, which will no doubt help your career. Once you develop data literacy, you can learn how to collect, organize, clean, analyze, and visualize data.
By helping your organization to make better decisions, you will reduce waste and increase efficiency. If you can save money in the budget, you might be able to negotiate a promotion (or raise) for yourself!

Speaking of negotiation, it helps to have extra skills at your annual performance review. If your employer knows that you worked to build your skill set, you will be viewed as a go-getter and a more valuable worker.
Having data literacy skills also makes you more desirable to many employers, which raises your value in the job market. This also gives you more options if you need to switch jobs or careers later on down the line.
This still raises the question of how to develop data literacy.
How To Develop Data Literacy
The best way to develop data literacy is to undertake projects where you can use the skills mentioned above: collecting, organizing, cleaning, analyzing, visualizing, and presenting data are all important.
For example, let’s say that your company is trying to figure out how to market a new product. You could undertake a data project to help with that effort.
First, you could put up a survey on the company’s website and social media accounts to get user feedback on how they rate various factors for your product, such as durability, appearance, etc. (collecting the data).
Next, you could clean up the data and segment it into categories, based on the source: website visitors, Facebook page visitors, LinkedIn visitors, etc. (organizing & cleaning the data).
Then, you could graph the survey results for each channel (company website, Facebook, LinkedIn, etc.) and compare the results to see how they compare. For example, you could find out which channel rates durability as the highest for your product (analyzing and visualizing data).
Finally, you could present this data to management and answer questions to help them make decisions about the marketing campaign for this product, based on what users in each channel find most important (presenting data).

Remember that there are 4 types of data analysis, depending on the intent:
- Descriptive – tell me what happened (describe the data).
- Diagnostic – tell me why it happened (explain things with the data).
- Predictive – tell me what will happen (use the data to make a forecast or predict the future).
- Prescriptive – tell me what to do (make a recommendation based on insight from data).
Conclusion
Now you know a little more about data literacy and what it means. You also have a better idea of how to develop data literacy and how it might help you in your career or to build your company.
I hope you found this article helpful. If so, please share it with someone who can use the information.
Don’t forget to subscribe to my YouTube channel & get updates on new math videos!
~Jonathon