
The mode of a data set gives you some indication of where the values are most clustered together. However, this also raises questions of what else mode tells us, and how it compares to other measures of center.
So, what does mode tell you about a data set? The mode of a data set tells you which value is most common (value with the highest frequency). The mode also tells you the maximum (peak) value on the graph of the data. A data set can have one, two, three, or more modes. Mode is not the same as mean or median, but they are equal in some cases.
Of course, mode is more resistant to outliers than the mean. However, mode is not a perfect measure by itself.
In this article, we’ll talk about the mode of a data set, what it tells you, and when to use it. We’ll also look at some examples to make the concept clear.
Let’s get started.
What Does Mode Tell You About A Data Set?
The mode of a data set is a descriptive statistic that tells you which value is the most common one. That is, the mode of a data set is the value that occurs with the highest frequency.
For example, in the data set {4, 5, 6, 6}, the mode is 6, since it appears twice, which is more than 4 or 5 (they each only appear once).
| Data Value | Frequency |
|---|---|
| 4 | 1 |
| 5 | 1 |
| 6 | 2 |
frequency of each data
value in the set above.
The mode also tells you the maximum on the graph of a data distribution. In other words, the mode is the “peak” of the data distribution, as you can see in the graph below.
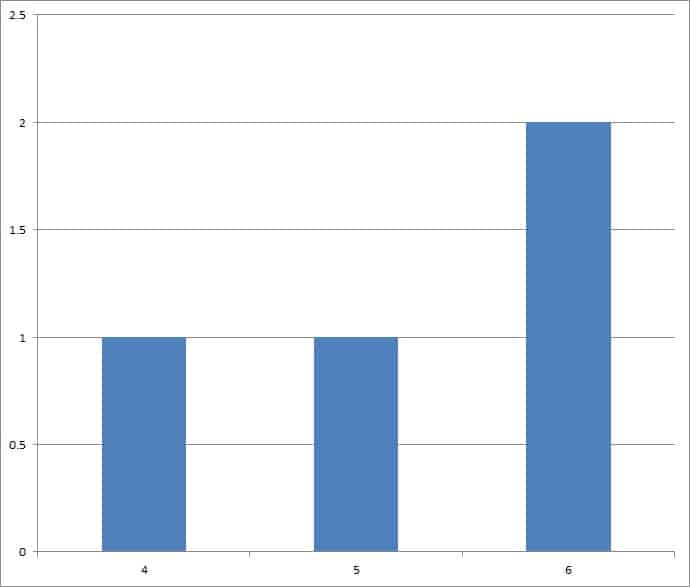
Remember that mode will always be a value from within the data set (the same is not always true for the mean).
Can Mode Be Two Numbers?
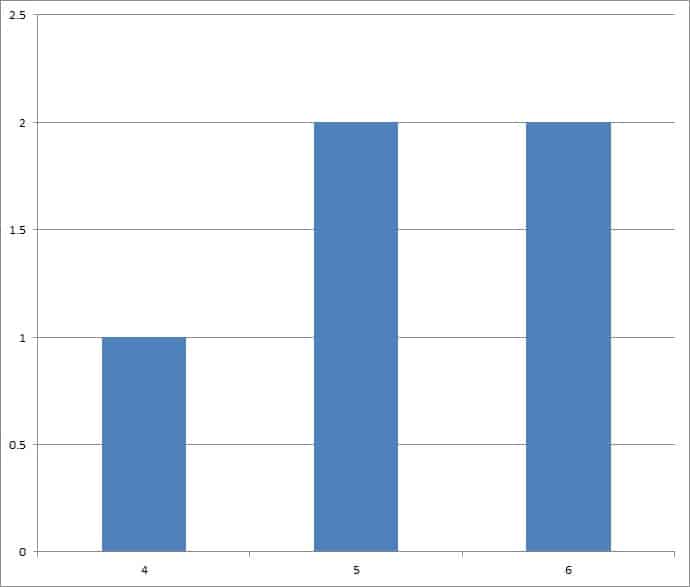
Mode can be two numbers in some cases. For example, consider the data set {4, 5, 5, 6, 6}.
| Data Value | Frequency |
|---|---|
| 4 | 1 |
| 5 | 2 |
| 6 | 2 |
frequency of each data
value in the set above.
In this case, the mode is 5 and 6, since both of those values appear twice in the data set. We call this distribution “bimodal”, and its graph has 2 peaks, as you can see in the graph below.
In fact, mode can be three or more numbers as well. For example, consider the data set {4, 5, 5, 6, 6, 7, 7}.
| Data Value | Frequency |
|---|---|
| 4 | 1 |
| 5 | 2 |
| 6 | 2 |
| 7 | 2 |
frequency of each data
value in the set above.
In this case, the mode is 5, 6, and 7, since each of those values appear twice in the data set. We call this distribution “trimodal”, and its graph has 3 peaks, as you can see in the graph below.
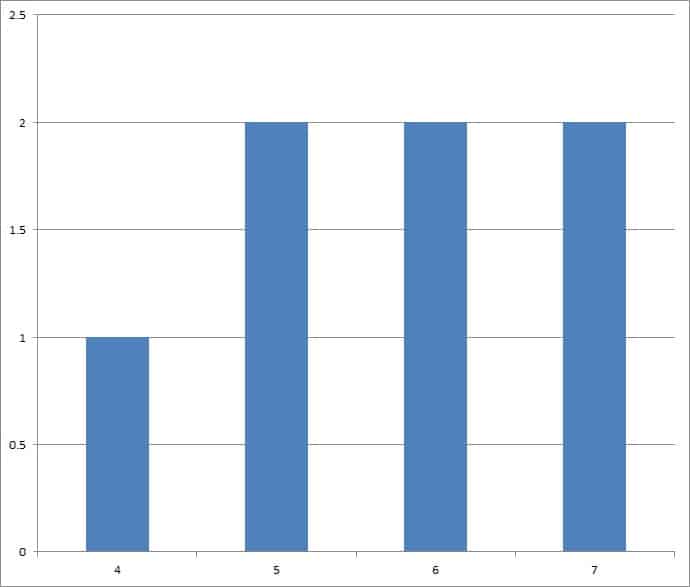
Note: a data set with only one mode is called unimodal. A data set with more than one mode is called multimodal.
Is Mode A Measure Of Center?
Mode is a measure of center, or a measure of central tendency. It attempts to tell us something about the typical (or central) value in a data set.
However, mode by itself is not perfect as a measure of central tendency. In some cases, it can mislead us.
For example, consider the data set {4, 4, 100, 101, 102, 103, 104, 105}. The mode is 4, since this value appears twice, and every other value appears only once.
| Data Value | Frequency |
|---|---|
| 4 | 2 |
| 100 | 1 |
| 101 | 1 |
| 102 | 1 |
| 103 | 1 |
| 104 | 1 |
| 105 | 1 |
frequency of each data
value in the set above.
However, 4 is not a good indication of the center of this data set. Most of the data (75%, or 6 out of 8 values) are in the range from 100 to 105.
As such, we might be better served by calculating other measures of center (such as mean and median) to give us a more complete picture of the data set.
Is Mode Affected By Outliers?
Most of the time, outliers will have very little effect on the mode of a data set. For example, let’s say we have the data set {4, 4, 4, 4, 5, 6}.
| Data Value | Frequency |
|---|---|
| 4 | 4 |
| 5 | 1 |
| 6 | 1 |
frequency of each data
value in the set above.
The mode is 4, since this value appears 4 times. Even if we add another large value to the data set (such as 100), it will not change the mode at all (since 4 still appears most frequently).
If we added 5 100’s to the data set, the mode would change to 100. However, in that case, the 100’s are no longer really outliers.
Is Mode The Same As Average?
Mode is not the same as average (or mean), since:
- Mode is the most often seen value in a data set (find out the value with the highest frequency).
- Mean is the average value in a data set (we sum all the data values and divide by how many data values there are).
However, there are certain specific cases when the mode is equal to the average (mean). For example, consider the data set {4, 5, 5, 6}.
| Data Value | Frequency |
|---|---|
| 4 | 1 |
| 5 | 2 |
| 6 | 1 |
frequency of each data
value in the set above.
In this case, the mode is 5 (since this value appears twice, and thus most often). The mean is also 5, since (4 + 5 + 5 + 6) / 4 = 20 / 4 = 5.
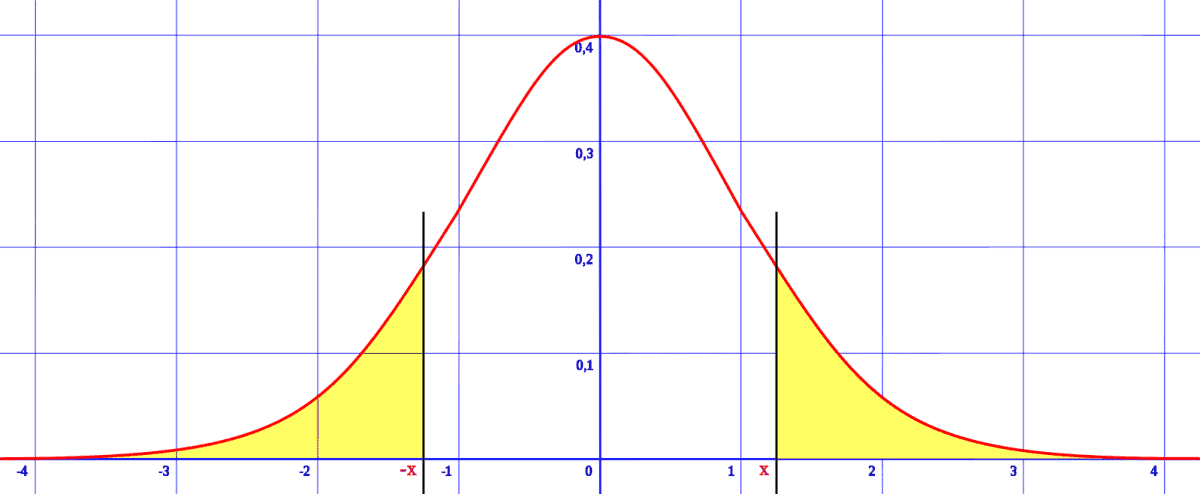
In any symmetric data set with a single mode, the mode and average (mean) will be the same. For example, in a normal distribution, the mode and average (mean) are the same (in fact, the mode, mean, and median are all the same!)

When Is Mode Better Than Mean?
If you have nominal data (given by names, rather than values), the mode is better than the mean. In fact, with nominal data, it is impossible to calculate a mean (unless you give each name a value) or a median (unless you find some way to order the data).
For example, consider the data set {Alex, Alex, Bob, Carl, Dave}. The mode is the name Alex, since it appears twice (more often than Bob, Carl, and Dave, which each only appear once).
| Data Value | Frequency |
|---|---|
| Alex | 2 |
| Bob | 1 |
| Carl | 1 |
| Dave | 1 |
frequency of each data
value in the set above.
Without values for each name, we cannot find a mean. However, we could use alphabetical order to find the median (which would be Bob).
Is Mode The Same As Median?
Mode is not the same as median, since:
- Mode is the most often seen value in a data set (find out the value with the highest frequency).
- Median is the middle value in a data set (we order the data values from lowest to highest, and then find the “middle” value in the ordered set).
Can Mode & Median Be The Same?
There are certain specific cases when the mode is equal to the median. For example, consider the data set {4, 5, 5, 6, 7}.
| Data Value | Frequency |
|---|---|
| 4 | 1 |
| 5 | 2 |
| 6 | 1 |
| 7 | 1 |
frequency of each data
value in the set above.
In this case, the mode is 5 (since this value appears twice, and thus most often). The median is also 5, since the middle data point is the third one in the ordered list.
A mentioned earlier, a normal distribution also has the same mode and median (in fact, the mode, mean, and median are all the same!)
When Is Mode Used In Statistics?
Mode is used in statistics when we have nominal data (names, not values), since mean and median may not have much meaning in those cases.
Mode can also be used for numerical values to find one or more “peaks” in the data distribution.
Can Mode Be Zero?
Mode can be zero. This happens when zero is the most often seen value in a data set.
Example 1: Mode Of Zero
Consider the data set {0, 0, 1, 2, 3}. The mode is zero, since it appears twice (as opposed to every other value, which appears only once).
| Data Value | Frequency |
|---|---|
| 0 | 2 |
| 1 | 1 |
| 2 | 1 |
| 3 | 1 |
frequency of each data
value in the set above.
Example 2: Mode of Zero
Consider the data set {-3, -2, -1, -1, 0, 0, 0, 1, 2}. The mode is zero, since it appears three times (more often than any other value).
| Data Value | Frequency |
|---|---|
| -3 | 1 |
| -2 | 1 |
| -1 | 2 |
| 0 | 3 |
| 1 | 1 |
| 2 | 1 |
frequency of each data
value in the set above.
Can Mode Be Negative?
Mode can be negative. This will only happen when there are negative values in the data set.
However, not all values in the data set need to be negative to yield a negative mode.
Example 1: Negative Mode
Consider the data set {-5, -4, -3, -3, -2, -1}. The mode is -3, since it appears twice (as opposed to every other value, which appears only once).
| Data Value | Frequency |
|---|---|
| -5 | 1 |
| -4 | 1 |
| -3 | 2 |
| -2 | 1 |
| -2 | 1 |
frequency of each data
value in the set above.
Example 2: Negative Mode
Consider the data set {-3, -2, -2, -1, 0, 1, 2}. The mode is -2, since it appears twice (as opposed to every other value, which appears only once).
| Data Value | Frequency |
|---|---|
| -3 | 1 |
| -2 | 2 |
| -1 | 1 |
| 0 | 1 |
| 1 | 1 |
| 2 | 1 |
frequency of each data
value in the set above.
Conclusion
Now you know more about the mode of a data set, what it tells you, and when to use it. You also know how it compares to mean (average) and median of a data set.
You can learn how to calculate the mode in Excel here.
You can learn more about data literacy in my article here.
I hope you found this article helpful. If so, please share it with someone who can use the information.
Don’t forget to subscribe to my YouTube channel & get updates on new math videos!
~Jonathon