
Median tells us about the center of a distribution, which can help us to understand a data set. However, median is just one statistical measure for data, and it has both advantages and limitations.
So, what is median used for? Median is a measure of central tendency that tells us where a data set is split into two equal halves. It is used for various purposes including: analyzing companies, benchmarking performance, tracking population changes, performing medical research, and human resources.
Of course, median is most useful when we combine it with other statistical measures, including mean, standard deviation, and others. This gives us a more complete picture of a data set and what it tells us.
In this article, we’ll take a look at some uses of median, along with some examples so that the concept is clear.
Let’s get started.
What Is The Median?
The median is a descriptive statistic that is a measure of central tendency.
Remember that the median (or “middle”) is the value that separates a data set (distribution) into two halves: the top half (or upper half) and the bottom half (or lower half).
In other words:
- 50% of the values in the data set are less than or equal to the median, and
- 50% of the values in the data set are greater than or equal to the median
For example, in the data set {1, 2, 3, 4}, the median is 2.5, since half of the values (1 and 2) are less than 2.5, and half of the values (3 and 4) are greater than 2.5.
Note that this definition means that for a data set with an odd number of values, we may have more than 50% of values above and below the median.
For example, in the data set {1, 2, 3, 4, 5}, the median is 3, and 60% of the values (1, 2 and 3) are less than or equal to 3, and 60% of the values (3, 4, and 5) are greater or equal to than 3.
What Is Median Used For?
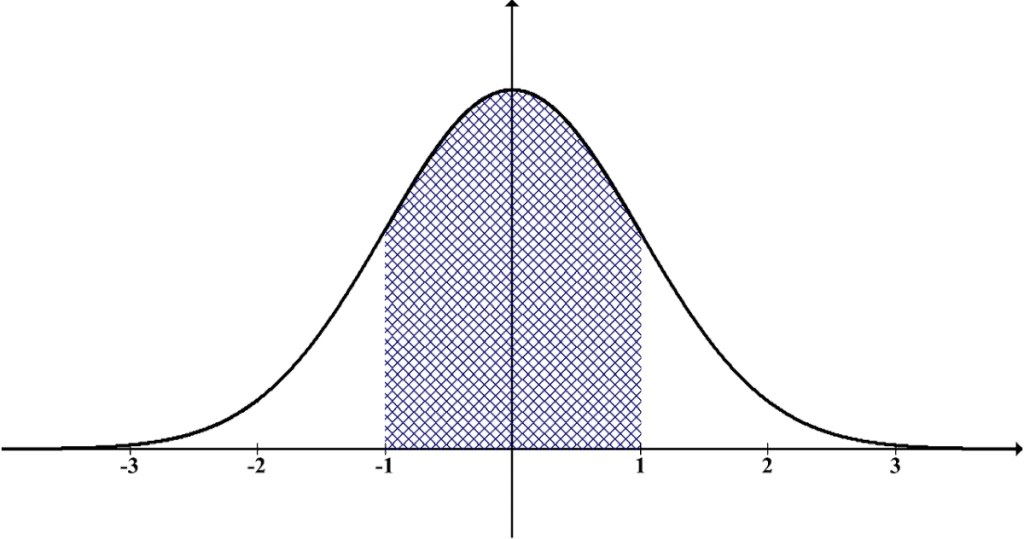
The median can tell us where the center of a graph is located, whether the graph is symmetric or asymmetric (skewed).
For example, the normal distribution below (which is symmetric) has a median in the middle of the distribution (in this case, the mean, median, and mode are all the same).
On the other hand, the skewed distribution below (which is asymmetric) has a median on the right side of the distribution.
The median also helps us to find the 50th percentile of a data set. This allows us to separate a data set into two “halves” of equal size:
- those with values at or above the median, and
- those with values at or below the median
The median is also one of the quartiles (the median is Q2, or the second quartile). It is used in the 5-number summary for a data set, which includes:
- Minimum – the lowest value in the data set
- Q1 – the first quartile of the data set (“25th percentile”)
- Q2 or median – the second quartile of the data set (“50th percentile)
- Q3 – the third quartile of the data set (“75th percentile)
- Maximum – the highest value in the data set
With these 5 values, we can give ranges that separate a data set into four equal parts, called quartiles:
- First Quartile: values between Minimum and Q1, in the range [Minimum, Q1)
- Second Quartile: values between Q1 and Q2, in the range [Q1, Q2)
- Third Quartile: values between Q2 and Q3, in the range [Q2, Q3)
- Fourth Quartile: values between Q3 and Maximum, in the range [Q3, Maximum)
(You can learn how to find quartiles in Excel here).
Sometimes, we use median along with mean (or other statistical measures) to give us a better understanding of a data set.
(You can learn more about the differences between mean and median here).
Uses Of Median (Applications Of Median)
There are lots of ways to put the concept of median to use, including:
- Analyzing companies (comparing two companies or comparing a company to the overall market).
- Performance benchmarks (comparing employees in the same role, over a given time period)
- Tracking a population over time (or comparing two populations)
- Researching effectiveness of a treatment (median time to recovery, median improvement in key metrics)
- Human resources (when looking at salaries or total compensation)
Let’s take a look at each of these uses in more detail. We’ll start with using median to analyze companies.
Analyzing Companies As Investments
When analyzing a company and its performance, we often use the mean to analyze a company (or to compare one company to another company or an entire index or market).

However, the mean alone does not always tell us the whole story. Sometimes, it makes sense to use median to get a better picture of what company data is telling us.
Example: Using Median To Compare Two Companies As Investments
Let’s say that company A has paid dividends of 2%, 2.5%, 1.5%, 2.5%, and 3% over the last 5 years. We can calculate the following statistics:
- Mean dividend = 11.5% / 5 = 2.3%
- Median dividend = 2.5%
The mean and median are close together. This suggests that there are no outliers (extreme values) in this data set.
It probably makes sense to use a value of between 2.3% (mean) and 2.5% (median) to make predictions for this company.
On the other hand, let’s say that company B has paid dividends of 10%, 0%, 1%, 0.5%, and 0.5% over the last 5 years. We can calculate the following statistics:
- Mean dividend = 12% / 5 = 2.4%
- Median dividend = 0.5%
The mean and median are much further apart than for company A. This suggests that there are outliers (the dividend of 10%) in this data set.
It may not make sense to use a value of 2.4% (the mean) to make predictions for this company. The returns have only been above 1% once in the last 5 years, and the 10% is quite high (and was a long time ago, suggesting that it may have come from cash that is now gone).
The mean dividend for company B is higher than for company A. However, the dividends for company A are much more consistent, with less volatility.
Performance Benchmarks
We can use median in several ways to benchmark performance.
One way is to figure out the median value of a group and compare the performance of one individual to the median.
Example: Using Median To Benchmark Performance
Let’s say the median figure for sales is $500,000 this year.
If Bob has sales of $600,000 for this year, then he is above the median (50th percentile). This tells us that Bob is making more sales than at least 50% of the other salespeople.
We can also look at Bob’s performance over time. For example, we can calculate the median sales for the past 5 years and compare Bob’s sales for each year.
Then, we can figure out how many years out of the past 5 he has been above the median.
Tracking A Population Over Time
We can use a median value to track how well a population is doing over time.
For example, remember that the median income tells us that:
- Half the population earns at or above that amount, and
- Half the population earns at or below that amount

Example: Using Median Income To Track A Population
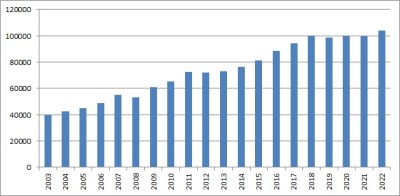
Let’s say that we track the median income of a population over a time period of 20 years. This can help us to figure out how well the “average” person is doing, while excluding extreme outliers (such as a few people with large incomes in the millions or billions).
The graph below shows some sample data of median incomes over the last 20 years. Based on this data, we can see when the economy might have had trouble and when it boomed.
Researching Effectiveness Of A Treatment
In medical or psychological research, we can compare the effectiveness of treatments by studying two groups: a treatment group (that receives the treatment) and a control group (that receives a placebo, or no treatment).

Sometimes, mean is used to measure a value (or the change in a value over time). However, we can also use median to measure a value or how it changes over time.
Example: Using Median To Research Effectiveness Of A Treatment
A study for a medication that lowers cholesterol has a treatment group and a control group. The cholesterol of each member of the group is taken at the beginning of the study and at the end of the study (1 year later).
After 12 months, the treatment group saw a median decrease of 25 mg per dL in total cholesterol. The control group saw an average decrease of 5 mg per dL in total cholesterol.
*Note: this means that 50% of the treatment group saw a decrease of at least 25 mg per dL in total cholesterol.
This suggests that the treatment may be effective in reducing cholesterol. We should dive deeper into the data (perhaps using the sample mean and standard deviation for both groups) to compare the means by using hypothesis testing.
Human Resources
When a company hires a person, they must also decide how much to offer a candidate in salary or total compensation (including paid time off).
The median is a measure that can help to find a reasonable starting point for negotiations.
For example, let’s say that the median number of vacation days at a company is 15. For a candidate who is good (but not the best ever), you might offer 16 vacation days per year (putting that candidate into the top 50% of employees for vacation time).
If the median salary for a role at the company is $70,000 per year, then you might offer a new graduate $60,000 per year (since that person has no experience in the role).
Conclusion
Now you know what the median is used for in mathematics. You also know its limitations and how we can use it in conjunction with other measures (such as mean, IQR, etc.)
You can learn how to calculate median in Excel here.
You can learn how to calculate percentiles in Excel here.
I hope you found this article helpful. If so, please share it with someone who can use the information.

Don’t forget to subscribe to our YouTube channel & get updates on new math videos!