
Mean and median are used often in statistics to help summarize the values in a data set. However, there are questions about how they are related, how they differ, and what they mean.
So, what is the difference between the mean and the median? The mean is the sum of all values divided by the number of data points in a set. The median is the middle value of the data points in increasing order. Mean and median are both measures of central tendency used to summarize data, but median is less affected by outliers in a data set.
Of course, we can use both mean and median to describe the same data set. Their relationship can also tell us about what the data set looks like.
In this article, we’ll talk about the difference between mean and median. We’ll also answer some common questions about these two statistics, along with some examples.
Let’s begin.
Mean vs Median (Difference Between Mean & Median)
The mean and median are two descriptive statistics that are calculated from the values in a data set.
Both are measures of central tendency. That is, we use them to get an idea of where the center of the data lies.
The mean is also called arithmetic mean, average, or expected value. Remember that mean can be negative, positive, or zero, depending on the values in the data set.
To calculate mean and median, we take all of the values in a data set into account. However, we do this in different ways for each one.
Let’s take a look at how mean and median are calculated, along with some examples to make the concept clear.
How Is Mean Calculated?
Mean is calculated by taking the sum of all values in the data set and dividing by the number of points in the data set.
So:
Mean = S / N
where S = the sum of all values in the data set
and N = the number of data points in the data set.
Let’s look at an example.
Example 1: Calculating Mean Of A Data Set
Let’s say we have the data set A = {0, 1, 2, 4, 4, 7, 7, 7, 9, 9}.
The sum of all values is S = 1 + 2 + 4 + 4 + 7 + 7 + 7+ 9 + 9 = 50.
The number of points in the data set is N = 10 (there are 10 numbers in the brackets). Note that we count repeated values (such as 7 or 9) more than once.
So, the mean of the data set is: S / N = 50 / 10 = 5.
Example 2: A Data Set With A Negative Mean
Let’s say we have the data set B = {-5, -4, -3, 0, 1, 5}.
The sum of all values is S = -5 + -4 + -3 + 0 + 1 + 5 = -6.
The number of points in the data set is N = 6 (there are 6 numbers in the brackets).
So, the mean of the data set is: S / N = -6 / 6 = -1.
What Does The Mean Tell You About A Data Set?
The mean is a measure of central tendency. It is meant to give us an idea about where to find the center (or middle) of the data set.
The mean takes into account the size (or magnitude) of every data point in the set.
However, the mean may have a value that is not one of the data points.
For instance, in the example above, the mean of the set A was 5, but there is no value of 5 in the data set.
Similarly, the mean of the set B was -1, but there is no value of -1 in the data set.
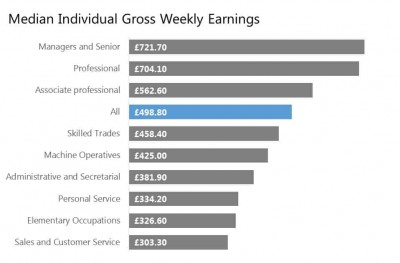
Also, remember that one large value in a set of small values can skew the mean towards the high value.
Example: Mean Is Skewed By One Large Value
Let’s say we have the data set C = {0, 1, 2, 4, 4, 7, 7, 7, 9, 4959}.
The sum of all values is S = 1 + 2 + 4 + 4 + 7 + 7 + 7+ 9 + 4959 = 5000.
The number of points in the data set is N = 10 (there are 10 numbers in the brackets). Note that we count repeated values (such as 7) more than once.
So, the mean of the data set is S / N = 5000 / 10 = 500.
The number 500 is not in the data set, and it is far away from the first 9 values (which are all less than 10). This is because the largest data point (4959) skews the mean towards a larger number.
How Is Median Calculated?
Median is calculated by ordering the values in the data set from smallest to largest and then taking the middle data point.
If the data set has an even number of data points, then we take mean of the two middle data points to get our median.
Example 1: Calculating The Median Of A Data Set With An Odd Number Of Values
Let’s say we have the data set D = {9, 1, 7, 2, 5, 4, 10}.
First, we order the values from smallest to largest:
D = {1, 2, 4, 5, 7, 9, 10}
This data set has an odd number of data points (there are 7 of them). To find the median, we take the middle value, which is 5.
We know that 5 is the middle value because there are 3 smaller numbers (1, 2, and 4) and 3 larger numbers (7, 9, and 10) in the data set.
D = {1, 2, 4, 5, 7, 9, 10}
Another way to find which number to take is to look at how many data points there are in the set. Here, there are 7 data points.
Add 1 to this number and divide by 2: (7 + 1) / 2 = 4. So, we take the 4th data point in the ordered set: 5 is the 4th number (out of 7 numbers), so it is the median.
Example 2: Calculating The Median Of A Data Set With An Even Number Of Values
Let’s say we have the data set E = {3, 1, 8, 6, 4, 9}.
First, we order the values from smallest to largest:
E = {1, 3, 4, 6, 8, 9}
This data set has an even number of data points (there are 6 of them). To find the median, we take the average of the two middle values (4 and 6) to get: (4 + 6) / 2 = 10 / 2 = 5.
As before, there are 3 numbers (1, 3, and 4) smaller than the median and 3 numbers larger than the median (6, 8, and 9) in the data set.
Another way to find which number to take is to look at how many data points there are in the set. Here, there are 6 data points.
Divide this number by 2: 6 / 2 = 3. So, we take the 3rd data point and the next one (the 4th point) and take their average to find the median.
What Does The Median Tell You About A Data Set?
The mean is a measure of central tendency. It is meant to give us an idea about where to find the center (or middle) of the data set.
In any data set, half of the data points are below the median, and half of the data points are above the median. In other words, the median is the 50th percentile of the data set (you can learn more about how to interpret percentiles in my article here).
After finding the value point (or two values in the case of an even number of data points), the median does not take the size (magnitude) of the other values in the data set into account.
The median may have a value that is not one of the data points.
For instance, in the example above, the mean of the set D was 5, but there is no value of 5 in the data set.
Similarly, the mean of the set E was 5, but there is no value of 5 in the data set.
Also, remember that one large value in a set of small values does not skew the median towards the high value.
Example: Median Is Not Skewed By One Large Value
Let’s say we have the data set F = {0, 1, 2, 4, 4, 7, 7, 9, 4959}.
The values in the data set are already in order.
There are 9 data points, so we look at the 5th data point, since (9 + 1) / 2 = 5.
The 5th data point is 4, which is the median of this data set.
The large value 4959 does not skew the median towards a larger value.
Can Mean & Median Be The Same?
Mean and median can be the same for a data set. The simplest example is a data set with one point.
The mean and median are both the same: the value of that data point.
Another example is the set G = {1, 4, 7}.
The mean is (1 + 4 + 7) / 3 = 4.
Likewise, the median is 4.
When the mean and median of a data set are the same, the data is symmetric. That is, the data is a “mirror image” to the left and to the right of the middle point (the mean or median).
When Are Mean & Median The Same?
The mean and median are the same for lots of data sets, but all of them are symmetric, including the following special cases:
- Data Set With One Point – the mean and median are both equal to the value of the one data point. For example, the set H = {2} has a mean of 2 and a median of 2.
- Uniform Distribution – this is a data set where every point has the same value. The mean and median are both equal to that one value. For example, the set I = {3, 3, 3, 3} has a mean of 3 and a median of 3.
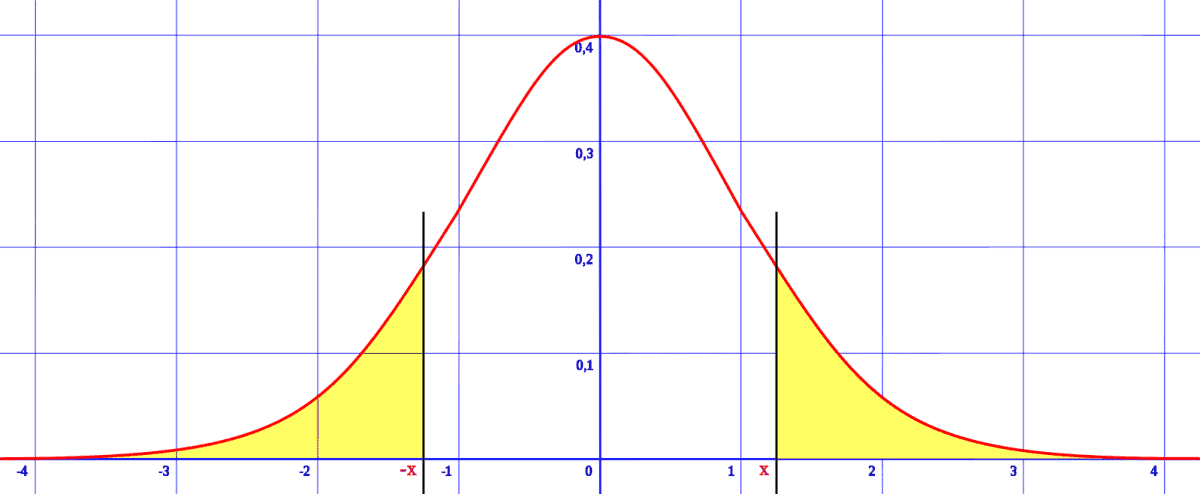
- Normal Distribution – this is a data set that looks like a bell when graphed. With a standard normal distribution, the mean and median are both zero.
What Does It Mean When Mean & Median Are Different?
When mean and median are different, it means that we have a skewed distribution. A skewed distribution is not symmetric, and there is more data to one side of the mean than on the other side.
Here are the possible cases for skewness of a data set:
- Mean > Median: if the mean is greater than the median, it means that there are more data points below the mean than above the mean. In this case, the data is skewed right.
- Mean < Median: if the mean is less than the median, it means that there are more data points below the mean than above the mean. In this case, the data is skewed left.
Let’s look at some examples.
Example 1: A Data Set That Is Skewed Right
Consider the data set J = {1, 2, 3, 4, 90}.
The mean is (1 + 2 + 3 + 4 + 90) / 5 = 20.
The median is 3.
So, the mean is greater than the median, since 20 > 3.
This means the data set is skewed right.
In other words, more of the data points (1, 2, 3, and 4) are below the mean than above the mean (only the data point 90 is above the mean).
Example 2: A Data Set That Is Skewed Left
Consider the data set J = {-90, 1, 2, 3, 4}.
The mean is (-90 + 1 + 2 + 3 + 4) / 5 = -16.
The median is 2.
So, the mean is less than the median, since -16 < 2.
This means the data set is skewed left.
In other words, more of the data points (1, 2, 3, and 4) are above the mean than above the mean (only the data point -90 is below the mean).
Conclusion
Now you know about the difference between mean and median. You also know how to compare the two and how they can tell you about the shape of a data set.
The table below summarizes the differences between mean and median at a glance.
| Attribute | Mean | Median |
|---|---|---|
| Calculation | S/N where: S = sum of all values; N = the number of values | Take the middle value in the data set. |
| Outlier Resistance | Low | High |
| Percentile | Varies | 50th |
| When To Use | Data set with no outliers. | Data set with one or more outliers. |
between mean and median at a glance.
I hope you found this article helpful. If so, please share it with someone who can use the information.
You can learn more about mean and what it is used for in my article here.
You can learn how to calculate median in Excel here.
You might also want to check out my article on the mode of a data set and what it tells you.
Don’t forget to subscribe to my YouTube channel & get updates on new math videos!
~Jonathon