
Finding the quartiles for a set of numbers helps us to get a sense of how the data is spread out. Microsoft Excel can find the quartiles (Q1, Q2, and Q3) for any set of values you choose as input.
So, how do you find quartiles in Excel? To find quartiles in Excel, use the QUARTILE function. The inputs for this function are an array of cells (row, column, or block) and a quartile (1 = lower quartile, 2 = median, 3 = top quartile). For example, the formula “=QUARTILE(A1:A8, 1)” gives the 1st quartile of the values in cells A1 to A8.
Of course, once we find the first and third quartiles (Q1 and Q3), we can find the interquartile range (IQR) by subtracting them (IQR = Q3 – Q1).
In this article, we’ll talk about how to find quartiles in Excel. We’ll also look at some examples to make the concept clear.
Let’s get started.
How To Find Quartiles In Excel
The easiest way to find a quartile in Excel is to use the “QUARTILE” function. This function takes two inputs, separated by commas.
The first input is an array of cells, which can be:
- a row (for example, “A1:J1” would be a row consisting of 10 cells)
- a column (for example, “A1:A8” would be a column consisting of 8 cells)
- a block of cells (for example, “A1:J8” would be a block of cells consisting of 8 rows and 10 columns, for a total of 8*10 = 80 cells)
- a named range (for example “my_values”, which could denote any set of cells you choose, including a row, a column, or a block of cells)
The second input is the quartile. This is an integer (whole number) value between 0 and 4 that tells Excel which quartile to find.
The quartiles are as follows:
- 0 gives the minimum, Q0, of the data set
- 1 gives the first quartile, Q1, of the data set (also known as lower or bottom quartile). This is the 25th percentile of the data.
- 2 gives the second quartile, Q2, of the data set (also called the median). This is the 50th percentile of the data.
- 3 gives the first quartile, Q3, of the data set (also known as upper or top quartile). This is the 75th percentile of the data.
- 4 gives the maximum, Q4, of the data set
(You can learn more about percentile, what it means, and how to interpret it here).
For example, here are some formulas for quartiles:
- The minimum (Q0) of the values in cells A1 to A8 (a column of 8 cells) would be given by the formula “=QUARTILE(A1:A8, 0)
- The first quartile (Q1) of the values in cells A1 to A8 (a column of 8 cells) would be given by the formula “=QUARTILE(A1:A8, 1). Note that the function =PERCENTILE(A1:A8, 0.25) would also work, giving the same result.
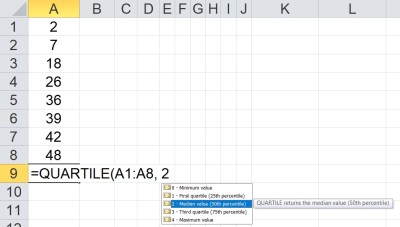
- The second quartile (Q2 or median) of the values in cells A1 to A8 (a column of 8 cells) would be given by the formula “=QUARTILE(A1:A8, 2). Note that the function =MEDIAN(A1:A8) would also work, giving the same result.
- The third quartile (Q3) of the values in cells A1 to A8 (a column of 8 cells) would be given by the formula “=QUARTILE(A1:A8, 3). Note that the function =PERCENTILE(A1:A8, 0.75) would also work, giving the same result.
- The maximum (Q4) of the values in cells A1 to A8 (a column of 8 cells) would be given by the formula “=QUARTILE(A1:A8, 4)
You can see an example for Q2 illustrated below.
How To Find Q1 In Excel (First Quartile In Excel)
To find Q1 in Excel, we use the QUARTILE formula with two inputs:
- The first input is the array containing the values in the data set.
- The second input is 1.
So the formula looks like this:
- =QUARTILE(my_values, 1)
where my_values is an array (row, column, or block of cells).
Note that Q1 is the median of the bottom 50% of the data set (between the minimum and median, or Q0 and Q2).
Let’s look at an example to see how it works in Excel.
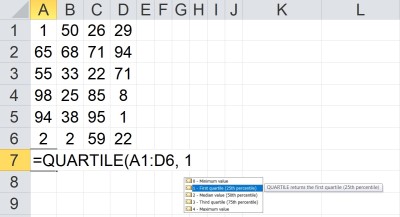
Example: How To Find Q1 In Excel
Let’s say we want to find the first quartile of the data in cells A1:D6 (24 values).
We would use the formula
- =QUARTILE(A1:D6, 1)
You can see this illustrated in Excel below.
How To Find Q2 In Excel (Second Quartile In Excel)
To find Q2 in Excel, we use the QUARTILE formula with two inputs:
- The first input is the array containing the values in the data set.
- The second input is 2.
So the formula looks like this:
- =QUARTILE(my_values, 2)
where my_values is an array (row, column, or block of cells).
Note that Q2 is the median of the entire data set (between the first and third quartiles, or Q1 and Q3).
Let’s look at an example to see how it works in Excel.
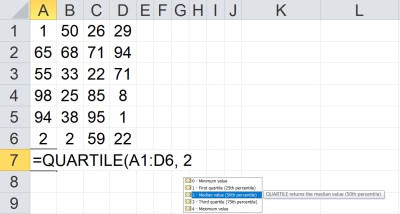
Example: How To Find Q2 In Excel
Let’s say we want to find the second quartile of the data in cells A1:D6 (24 values).
We would use the formula
- =QUARTILE(A1:D6, 2)
You can see this illustrated in Excel below.
How To Find Q3 In Excel (Third Quartile In Excel)
To find Q3 in Excel, we use the QUARTILE formula with two inputs:
- The first input is the array containing the values in the data set.
- The second input is 3.
So the formula looks like this:
- =QUARTILE(my_values, 3)
where my_values is an array (row, column, or block of cells).
Note that Q3 is the median of the upper half of the data set (between the median and maximum, or Q2 and Q4).
Let’s look at an example to see how it works in Excel.
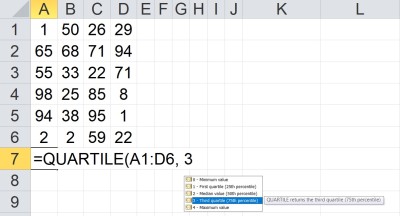
Example: How To Find Q3 In Excel
Let’s say we want to find the third quartile of the data in cells A1:D6 (24 values).
We would use the formula
- =QUARTILE(A1:D6, 3)
You can see this illustrated in Excel below.
How To Find What Quartile A Value Is In (Excel)
If you want to find out what quartile a value is in, you can use nested IF statements in Excel. You just need to know the values of the three quartiles Q1, Q2, and Q3.
For a value in cell B2, the formula with nested IF statements would look like this:
- =IF(B2 <= Q1, “Q1”, IF(B2 < Q2, “Q2”, IF(B2 < Q3, “Q3”, “Q4”)))
Note that for the above formula to work, you would need to have named ranges (variables) Q1, Q2, Q3, and Q4 defined, each containing the corresponding quartile (you can use the QUARTILE function to calculate these values from your data set).
How To Find IQR In Excel (Interquartile Range In Excel)
To find IQR in Excel, subtract Q1 from Q3 (that is, IQR = Q3 – Q1). For a data set in the named range my_values, the formula would be:
- =QUARTILE(my_values, 3) – QUARTILE(my_values, 1)
Note that the IQR is somewhat similar to the range:
- Range is the width of the entire data set (Range = Maximum – Minimum, or Range = Q4 – Q0).
- IQR is the width of the middle 50% of the data set (IQR = Q3 – Q1, or 75th percentile minus 25th percentile).
IQR is the width of the data subset that excludes both the top 25% and the bottom 25% of the original data set.
You can see this illustrated in the box plot (box and whisker plot) below.
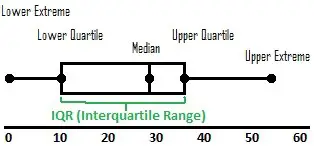
You can learn more about box plots here.
How Does Excel Calculate Quartiles?
Excel calculates quartiles using minimums, maximums, medians, and percentiles.
Start with the minimum and maximum (Q0 and Q4):
- Q0, the minimum, is the smallest value in an array (remember that negatives are smaller than 0, and that the largest negative number is actually the minimum in a data set). We could use the formula “=MINIMUM(my_values)
- Q4, the maximum, is the largest value in an array. We could use the formula “=MAXIMUM(my_values)
Then, we can find the second quartile (Q2) with the median function:
- Q2, the second quartile, is the median value (50th percentile) in an array. At least 50% of the data is greater than or equal to the median, and at least 50% of the data is less than or equal to the median. We could use the formula “=MEDIAN(my_values)”.
Remember that the median function works by finding the “middle” value in a sorted data set. There are two possibilities, depending on the count of values in the data set:
- If the count is odd (2N + 1), then the middle value is the (N+1)st value in the sorted list.
- If the count is even (2N), then the two middle values are averaged. That is, we take the arithmetic mean of the Nth and (N+1)st values in the sorted list.
Note that you could also use a percentile function to find Q2: “=PERCENTILE(my_values, 0.50).
Now, we can find Q1 and Q3 as follows (using percentiles again):
- Q1, the first quartile, is the 25th percentile in an array. At least 25% of the data is less than or equal to Q1, and at least 75% of the data is greater than or equal to Q1. We could use the formula “=PERCENTILE(my_values, 0.25)”.
- Q3, the third quartile, is the 75th percentile in an array. At least 75% of the data is less than or equal to Q1, and at least 25% of the data is greater than or equal to Q1. We could use the formula “=PERCENTILE(my_values, 0.75)”.
What Is The Meaning Of Quartile In Excel?
Remember that quartiles are a measure of spread. Quartiles help us to get an idea of where the “middle” of a data set lies (median, or Q2) and also how the quarters are spread out (minimum = Q0, Q1, Q3, and Q4 = maximum).
Quartiles are a good way to split a group into subcategories. For example:
- You can split salespeople into four groups based on sales volume or revenue.
- You can split city residents into four groups based on annual income, home values, etc.
- You can see where a given day, season, or year falls in terms of historical temperature (bottom 25% for the past decade, top 25% in the last century, etc.)
- You can split a population into quartiles based on health measures such as height, weight, etc.

Why Is QUARTILE Not Working In Excel?
- If the array (the first argument) is empty (there are no values), then QUARTILE will return a #NUM! error.
- If the quartile (the second argument) is less than 0 (negative) or greater than 4, then QUARTILE will return a #NUM! error.
If you are getting unexpected results, make sure that any named ranges you are using as inputs to the QUARTILE function are capturing the array of values you want.
Also, make sure that you are entering the correct quartile (the second argument). If you enter a decimal value between 0 and 4, it is truncated (that is, everything after the decimal point is discarded, so 1.5 becomes 1, 2.4 becomes 2, 3.9 becomes 3, etc.)
Conclusion
Now you know how to find quartiles in Excel, what they mean, and what they can tell you about a data set. You also know how to find the IQR (interquartile range) by subtracting Q1 from Q3 (IQR = Q3 – Q1).
You can learn how to calculate percentages in Excel here.
You can learn how to find mean in Excel here.
You can learn how to find median in Excel here.
You can learn how to find mode in Excel here.
I hope you found this article helpful. If so, please share it with someone who can use the information.

Don’t forget to subscribe to our YouTube channel & get updates on new math videos!