
Statistics is a useful discipline when applied to many fields – from biology to infrastructure and much more. As “big data” grows ever larger, it becomes even more important to have a good grasp of statistics and what they can tell you.
So, what are some uses of statistics? Some uses of statistics include: biology, business growth, economics, farming & gardening, groceries, housing, infrastructure, medicine, warranties, and website performance. Mean, median, and standard deviation are all statistical measures that can help us to analyze data.
Of course, in addition to telling you about the past, statistics can give you some insight into the present and future.
In this article, we’ll talk about 10 uses of statistics. We’ll also go into detail about what types of statistical methods are used in each of these examples.
Let’s get started.
Uses Of Statistics
Statistics is used in lots of different ways in many fields, and many different methods are used, including: data analysis (mean, standard deviation, etc.), regression, forecasting projections, confidence intervals, hypothesis testing, and probability distributions.
Here are some specific examples of how we can use statistics in various disciplines:
- Biology (studying samples from a population)
- Business Growth (revenue, profit, etc.)
- Economics (unemployment rate, average income, etc.)
- Farming & Gardening (seed germination rate, crop yield, etc.)
- Groceries (how many goods to order and keep on hand)
- Housing (determining if rents and home prices are rising, flat, or falling)
- Infrastructure (cars & trucks per year going over a bridge)
- Medicine (effectiveness of treatments)
- Warranties (how long will a product last)
- Website Performance (speed, conversion rate, etc.)
Let’s take a closer look at how statistics is used in each of these fields, starting with Biology.
Biology
Statistics is used in biology to study samples from a population. We can use the data from a sample to make predictions about the entire population.
We can also use data from two different samples from two different populations to see how they differ.
Example: Using Statistics To Compare Two Populations
Let’s say that you have data on the weight of a frog species from two samples:
- The first group lives in Western Massachusetts, with an average weight of 16 ounces and a standard deviation of 2 ounces.
- The second group lives in Virginia, with an average weight of 13 ounces and a standard deviation of 1 ounce.

We can use a hypothesis test to see whether the average weight differs between these two samples. If it does differ, we can then ask questions and investigate why (is it their diet, higher predation of larger frogs further south, etc.?)
Business Growth
We can use statistics to tell us how fast a business is growing (growth rate) or how it compares to other similar sized businesses in the same industry.
Example: Using Statistics To Track Business Growth
Let’s say that a business has the following statistics:
- 2017: Revenue = $200,000 and Profit = $150,000
- 2018: Revenue = $400,000 and Profit = $200,000
- 2019: Revenue = $800,000 and Profit = $280,000
- 2020: Revenue = $1,000,000 and Profit = $300,000
Based on the increases in both revenue and profit, it looks like this business is growing steadily. It appears to be healthy. However, there is one concern that we should address, which is profit margin (profit divided by revenue):
| Revenue | Profit | Profit Margin |
|---|---|---|
| $200,000 | $150,000 | 75% |
| $400,000 | $200,000 | 50% |
| $800,000 | $280,000 | 35% |
| $1,000,000 | $300,000 | 30% |
business grows, it might be a
good idea to examine costs.
The profit margin of this business has been decreasing every year. This means that costs are taking up a larger percentage of revenue every year.
If this trend continues, profit will decrease even as revenue grows. Eventually, the business could become unprofitable.
Economics
Statistics is also used to track the economy through measures such as unemployment and income.
Example: Using Median Income To Track An Economy
The following graph gives the median household income in the U.S. from 1984 to 2020 (in 2020 dollars – data from the Federal Reserve):
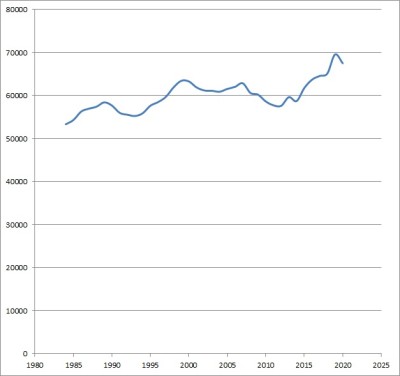
From the graph, we can see when the approximate years when the median household income was increasing:
- 1984 to 1989
- 1993 to 1999
- 2004 to 2007
- 2012 to 2013
- 2014 to 2019
This lines up with U.S. recessions in the early 1990’s, early 2000’s, and the late 2000’s (Great Recession).
Farming & Gardening
Statistics is used to track seed germination rates, crop yield, and other metrics for farming or gardening.
Example: Using Statistics To Predict Crop Yield In Farming
Last year, a farm produced 3,000,000 pounds of potatoes on 100 acres of land. This comes out to an average of 30,000 pounds per acre (3,000,000 divided by 100).

This year, the farm plans to devote 125 acres of land to growing potatoes. They make a prediction that they will get the same yield per acre this year as they did last year.
The expected yield of potatoes is:
- (Land Area In Acres)*(Yield Per Acre)
- =(125 acres)*(30,000 pounds per acre)
- =3,750,000
The farm expects to grow 3.75 million pounds of potatoes this year.
Groceries
Grocery stores need to make sure that they order the right amount of produce and other perishable goods for the shelves.
- If they order to little, some customers won’t be able to buy produce, and they will be disappointed.
- If they order too much, then lots of produce will go bad before they can sell it.
Statistics can help them to do this. Based on the time of year and the demand for produce during those times, they can predict how much they will need to keep in stock (and thus how much to order).

Housing
Statistics is also useful in rental housing. For example, you can compare vacancy rates in your property to industry averages your location.
(You can check vacancy rates at the national level on the Federal Reserve website).

If your vacancy rates are below average, it could mean a few things:
- Rent is too low. Tenants are lining up to lease from you since it is a good deal at the current price, compared to other similar properties in the area.
- Good management. This leads to low tenant turnover, which means your tenants stay a long time (since they don’t have to deal with delayed building maintenance and the annoyances that go with it).
- Tight housing market. This is not within your control. Even if your rents are high and management is poor, a tight housing market is “a tide that lifts all boats” (or landlords).
On the other hand, if your vacancy rates are above average, it could mean a few things:
- Rent is too high. Tenants are leaving your property to find lower rents offered by comparable buildings nearby.
- Poor management. This leads to high turnover, which means your tenants move often (because they don’t want to put up with poor building maintenance).
- Weak housing market. This is not within your control. Even if your rents are low and management is good, a weak housing market can mean apartments sit vacant for months.
Infrastructure
Statistics can also tell us how much “wear and tear” a road or bridge goes through each year, based on how many cars drive over it. This can tell us how often we need to pave a road or replace a bridge.
Increased traffic leads to cost increases for cities and towns. If the population of a town increases, it will attract more businesses to serve those people.

Those businesses will create jobs, and there will be more traffic on the town’s roads: residents of the town driving on the roads, trucks shipping goods to and from stores, and commuters driving to and from jobs at the new businesses in town.
All of that extra traffic means that the roads will be torn up faster (leading to cracks and potholes). Despite increased tax revenue for the town (due to residential and business growth), there will be extra costs (more infrastructure maintenance and more school, police, and fire spending).
Medicine
Statistics are used in medicine to study the effectiveness of a treatment or to compare two treatments to see which is more effective.
Example: Using Statistics To Rate Effectiveness Of A Treatment
In a study, there are two groups of people:
- The first group goes on a specific diet, as directed by a doctor.
- The second group is a control group (this just means that they don’t change their usual diet).
After one full year on the diet, the first group sees an average weight loss of 10%. The second group sees an average weight loss of 0% (that is, no change in the average weight).
It seems that the diet has an effect on weight loss. However, we would need to do a hypothesis test to see if the diet really does have an effect.

For the hypothesis test, our null hypothesis is that “the diet has no effect”, and our test would determine whether we reject that hypothesis or not.
The outcome of the hypothesis test would depend on several things, including:
- the size of each group in the diet study
- the significance level that we choose (5%, 1%, etc.)
Warranties
Often, a company will offer a warranty on a product they sell. This acts as a sort of “guarantee” to the customer that the product will last and perform as expected for a certain time.

The company wants to offer a warranty of the right length, since:
- A warranty that is too short will not have any value to the customer, and won’t help much with marketing and consumer confidence.
- A warranty that is too long means that the company will have to replace lots of their product free of charge, which is a good way for a business to go bankrupt.
Example: Using Statistics To Figure Out Warranty Length
A company does testing and finds out that the useful lifespan of their product has an approximately normal distribution, with a mean of 36 months and a standard deviation of 6 months.
They want to make sure that most of their customers will not need to use the warranty, so they decide to make the warranty “mean minus 2 standard deviations”, or 36 – 2*6 = 24 months (2 years).
This means that approximately 2.5% of their customers will receive a product that lasts less than 2 years. So, the company will be on the hook for the warranty for 2.5% of customers.
This warranty is a reasonable length, so customers have confidence in buying. It also means that the company won’t have to replace too many of its products for free over time.
Website Performance
Statistics can also help you to keep track of website speed, which is a good way to improve performance. A faster loading speed can prevent people from bouncing off the page due to long waits.
Example: Using Statistics To Track Website Performance
You have been tracking the performance of your website in terms of average page load time and conversion rate for a few months now. The data is shown in the table below:
| Average Page Load Time | Conversion Rate |
|---|---|
| 3.5 seconds | 0.9% |
| 3.1 seconds | 1.0% |
| 2.8 seconds | 1.05% |
improves, conversion rate
generally improves with it.
As you can see, faster page load times result in a higher conversion rate. This is because fewer people leave the site when it loads quickly (since faster loading means a better user experience).
If possible, you should invest time or money into improving page load speed to help improve conversion rate and profitability for your website.
Conclusion
Now you know how you can use statistics in various disciplines to understand data. Maybe this article has given you some ideas on how to make better use of the data you have at hand.
You can learn more about data literacy in my article here.
Some statistics are resistant to outliers, while others are not – you can learn more here.
You might also want to read my article on how statistics is used specifically in business.
I hope you found this article helpful. If so, please share it with someone who can use the information.
Don’t forget to subscribe to my YouTube channel & get updates on new math videos!
~Jonathon