
Box plots are used often in statistics to give a visual summary of a data set. However, this still raises the question of what exactly they reveal, and what we can calculate from what we are given.
So, what does a box plot show? A box plot is a graph showing five values: the minimum, maximum, median, and first & third quartiles of a data set. It is a visual summary of data, showing quartiles (groups of 25% of data points). A box plot also shows the spread of data, since we can calculate range and IQR (interquartile range).
Of course, a box plot does not show every possible statistic we can think of. In particular, a box plot does not show the mean, mode, or standard deviation of a data set.
In this article, we’ll take a closer look at what a box plot shows and what we can calculate from these given values. We’ll also take a look at some other statistics that a box plot does not show and answer some other common questions.
Let’s get started.
What Does A Box Plot Show?
A box plot (sometimes called a box and whisker plot) shows these five statistics:
- Minimum (Q0) – this is the lowest value in the data set (0th percentile). It is called Q0 because it is the 0th quartile. That is, there are no data points below this value (the exception is any outliers that were excluded). It is the bottom whisker (for a vertical box plot) or the furthest left whisker (for a horizontal box plot).
- First Quartile or Lower Quartile (Q1) – this is the value in the data set that is higher than 25 percent of the other data points (25th percentile). It is called Q0 because it is the 1st quartile. That is, one quarter of the data points are below this value.
- Median or Second Quartile (Q2) – this is the value in the data set that is higher than 50 percent of the other data points (50th percentile). It is called Q2 because it is the 2nd quartile. That is, two quarters (one half) of the data points are below this value.
- Third Quartile or Upper Quartile (Q3) – this is the value in the data set that is higher than 75 percent of the other data points (75th percentile). It is called Q3 because it is the 3rd quartile. That is, three quarters of the data points are below this value.
- Maximum (Q4) – this is the largest value in the data set (100th percentile). It is called Q04 because it is the 4th quartile. That is, four quarters of the data points are below this value. In other words, there are no data points above this value (the exception is any outliers that were excluded). It is the top whisker (for a vertical box plot) or the furthest right whisker (for a horizontal box plot).
(You can learn how to find quartiles in Excel here).
A box plot summarizes a data set by presenting these five values in a visual way on a graph (either vertically or horizontally). Multiple box plots on the same graph can compare two or more data sets side-by-side.
Here is an example of a vertical box plot:
Here is an example of a horizontal box plot:
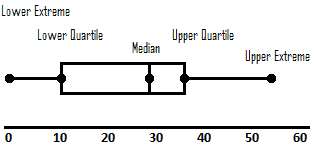
In the box plot above, you can see that the edges of the “box” are the values of Q1 and Q3. There is also a line at the median (Q2), which splits the box into two parts.
Note that these two parts of the box (Q1 to Q2 and Q2 to Q3) do not necessarily have to be the same size, as the example above shows.
There are some other statistics we can calculate from the information given in a box plot, including:
- Range
- IQR (Inter Quartile Range)
However, there are some other values that we can only find in certain specific cases. (We’ll get into those later).
Can You Find The Minimum From A Box Plot?
You can find the maximum from a box plot by looking for the bottom whisker (on a vertical box plot) or the furthest left whisker (on a horizontal box plot).
Let’s look at an example to see how it’s done.
Example: Finding The Minimum From a Vertical Box Plot
Consider the box plot below:
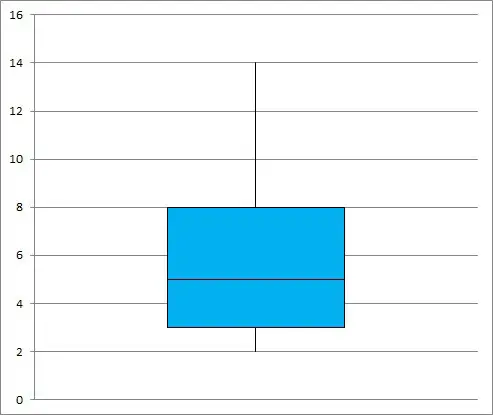
The lowest value (bottom whisker) on this box plot is on the horizontal line at y = 2.
So, the minimum (Q0) for this data set is 2.
Can You Find The Maximum From A Box Plot?
You can find the maximum from a box plot by looking for the top whisker (on a vertical box plot) or the furthest right whisker (on a horizontal box plot).
Let’s look at an example to see how it’s done.
Example: Finding The Maximum From a Vertical Box Plot
Consider the box plot below:
The highest value (top whisker) on this box plot is on the horizontal line at y = 14.
So, the maximum (Q4) for this data set is 14.
Can You Find The Median From A Box Plot?
You can find the median from a box plot by looking for the line inside the central box that separates it into two parts. The idea is the same for both vertical and horizontal box plots.
Let’s look at an example to see how it’s done.
Example: Finding The Median From a Vertical Box Plot
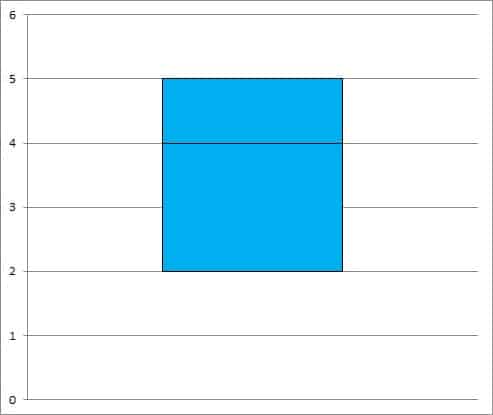
Consider the box plot below:
The line inside the blue box (that separates it into two parts) is on the horizontal line y = 5.
So, the median (Q2) for this data set is 5.
Similarly, the first quartile (Q1) is 3 (top line of blue box), and the third quartile (Q3) is 8 (bottom line of blue box).
Can You Find The Range From A Box Plot?
The range is not listed on a box plot. However, we can calculate it after we find the maximum and minimum.
All we have to do is take the difference:
- Range = Maximum – Minimum
Let’s look at some examples to see how it’s done.
Example: Finding The Range From a Vertical Box Plot
Consider the box plot below:
As we found earlier, the maximum is 14, and the minimum is 2.
To find the range, we take the difference: range = maximum – minimum = 14 – 2 = 12.
This difference (the range) tells us how “spread out” the data is, from smallest to largest value. A large range means the extreme data values (maximum and minimum) are far apart.
Can You Find IQR (Inter Quartile Range) From A Box Plot?
The IQR (Inter Quartile Range) is not listed on a box plot. However, we can calculate it after we find the first and third quartiles (Q1 and Q3).
All we have to do is take the difference:
- IQR = Q3 – Q1
Let’s look at some examples to see how it’s done.
Example: Finding The IQR From a Vertical Box Plot
Consider the box plot below:
As we found earlier, the first quartile (Q1) is 3, and the third quartile (Q3) is 8.
To find the IQR, we take the difference: IQR = Q3 – Q1 = 8 – 3 = 5.
This difference (the IQR) tells us how “spread out” the middle 50% of the data is. A large IQR means the middle 50% of data values (between the first and third quartiles) are spread far apart.
Can You Find The Mean From A Box Plot?
The mean is not listed on a box plot. In general, a box plot will not tell us the mean of a data set.
However, if the mean happens to equal the median, then we can find the mean by finding the median (as described above).
The mean will equal the median when the data has a symmetric distribution (for example, a normal distribution.)
Remember that a normal distribution looks like this:

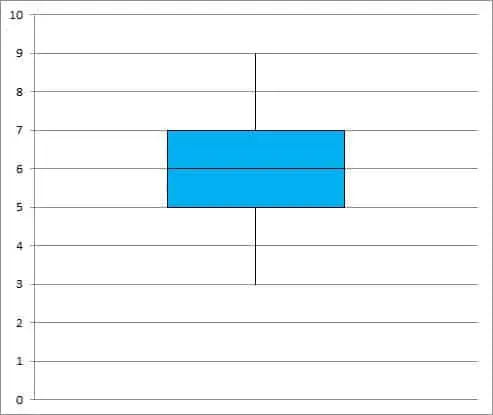
The box plot of a symmetric data set would look like this:
Can You Find The Mode From A Box Plot?
The mode is not listed on a box plot. In general, a box plot will not tell us the mode of a data set.
However, if the mode happens to equal the median, then we can find the mode by finding the median (as described above).
The mode will equal the median for certain data sets (for example, a normal distribution.) See the box plot above for a data set where the mode and median are equal (both are 6).
Can You Find Standard Deviation From A Box Plot?
The standard deviation is not listed on a box plot. In general, a box plot will not tell us the standard deviation of a data set.
However, the range and interquartile range do give us some idea of the spread of a data set.
Can A Box Plot Be Skewed?
A box plot can be skewed if the data is skewed. A box plot will have no skew if the data has no skew (as in a symmetric data set, such as a normal distribution).
More specifically, we should compare these two differences:
- DT = Maximum – Median (the width of the top 50% of the data).
- DB = Median – Minimum (the width of the bottom 50% of the data).
There are 3 cases to consider:
- Case 1: DT > DB – in this case, the data is skewed right. (On a vertical box plot, the part above the median is longer than the part below the median. On a horizontal box plot, the part to the right of the median is longer than the part to the left of the median.)
- Case 2: DT = DB – in this case, the data is not skewed. (On a vertical box plot, the part above the median is equal to the part below the median. On a horizontal box plot, the part to the right of the median is equal to the part to the left of the median.)
- Case 3: DT < DB – in this case, the data is skewed left. (On a vertical box plot, the part above the median is shorter than the part below the median. On a horizontal box plot, the part to the right of the median is shorter than the part to the left of the median.)
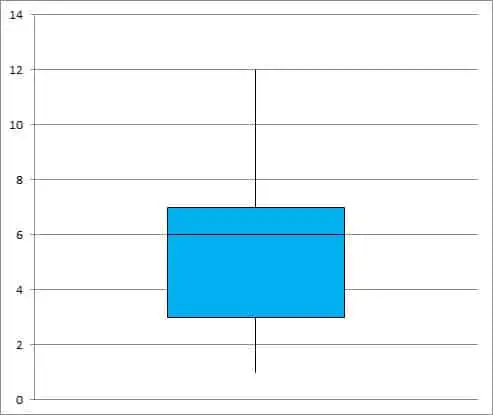
In the example below, the data is skewed right.
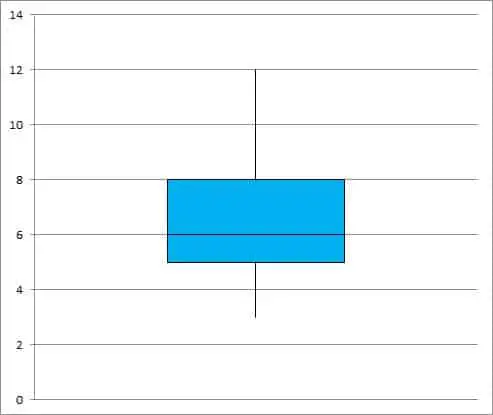
We can tell because we can find the following from the box plot:
- Minimum = 3
- Median = 6
- Maximum = 12
We can use these to calculate the following:
- DT = maximum – median = 12 – 6 = 6
- DB = median – minimum = 6 – 3 = 3
So DT > DB (since 6 > 3).
Can A Box Plot Have No Whiskers?
A box plot can have no whiskers in some cases. It can be missing the bottom/leftmost whisker, the top/rightmost whisker, or both.
Remember that the bottom whisker (for a vertical box plot) or leftmost whisker (for a horizontal box plot) extends from Q1 to the minimum value.
If Q1 is equal to the minimum value, then the bottom/leftmost whisker will have no length.
Similarly, the top whisker (for a vertical box plot) or rightmost whisker (for a horizontal box plot) extends from Q3 to the maximum value.
If Q3 is equal to the maximum value, then the top/rightmost whisker will have no length.
If both of these conditions are true at once (Q1 = minimum and Q3 = maximum), then the box plot will have no whiskers at all.
Conclusion
Now you know what a box plot shows you and what you can calculate from it. You also know what a box plot does not show.
I hope you found this article helpful. If so, please share it with someone who can use the information.
Don’t forget to subscribe to my YouTube channel & get updates on new math videos!
~Jonathon