
You will often see both quadratic and exponential functions in math, science, finance, and other topics. It can be helpful to see the differences between them compared side-by-side.
So, what is the difference between quadratic and exponential functions? A quadratic function is graphed as a parabola, changes the sign of its slope at the vertex, and has differences that increase by a constant amount in each time interval. An exponential growth function is graphed as an increasing convex curve, has an ever-increasing positive slope, and increases by a constant percentage in each time interval.
Of course, the function you use depends on what you are trying to model. For example, quadratic functions are useful for acceleration due to gravity, while exponential growth functions are useful for compound interest and investments (you may also use exponential decay in some cases).
In this article, we’ll talk about the differences between quadratic and exponential functions. We’ll also answer some common questions and look at examples to make the concepts clear.
Let’s get started.
What Is The Difference Between Quadratic & Exponential Functions? (Quadratic vs. Exponential)
The key difference between quadratic and exponential functions is the slope (first derivative) of the curves (that is, the rate of change over time):
- A quadratic function has a slope that changes signs at the vertex (and a constant, nonzero second derivative).
- An exponential growth function has a positive slope that increases without bound as x increases (an exponential decay function has a negative slope that gets closer to zero as x increases).
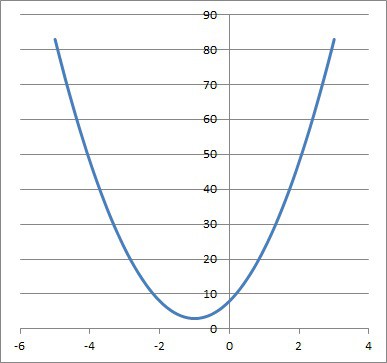
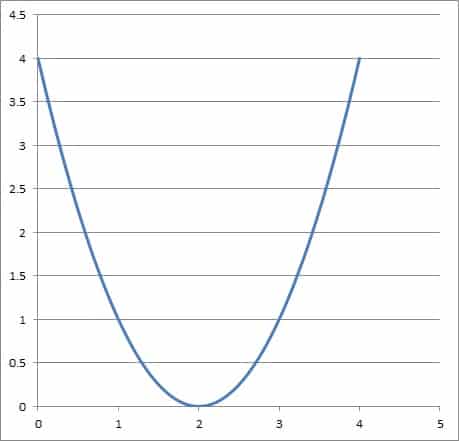
On a graph, a quadratic function is a parabola of the form y = ax2 + bx + c, like the one shown below.
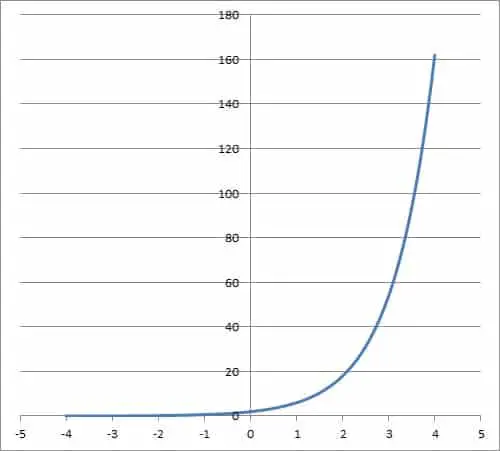
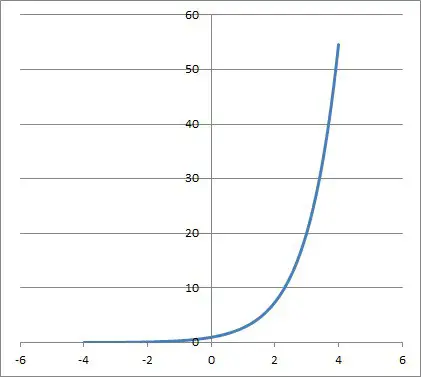
On the other hand, an exponential growth function is an increasing convex (concave up) curve, like the one shown below.
The following table shows the differences between linear and exponential growth functions at a glance.
| Function Type | Quadratic | Exponential |
|---|---|---|
| Slope (1st difference) | linear | also an exponential function |
| Concavity 2nd difference) | constant (nonzero) | also an exponential function |
| Equation | ax2 + bx + c a tells us the concavity; c tells us the y-intercept | cdx c = growth factor d = base |
| Table | look for first differences of y values that increase by a constant amount | look for y values that increase by a constant ratio |
| Graph | parabola | increasing convex curve |
| Phrases in a word problem | constant second differences; constant acceleration | doubling, halving, percent increase, percent decrease, population growth, bacterial growth, radioactive decay. |
and exponential growth functions at a glance.
How Do You Know If An Equation Is Quadratic Or Exponential?
To tell if an equation is quadratic or exponential, remember the form of each one:
- A quadratic equation has the form g(x) = ax2 + bx + c. [The value of a is the coefficient of the quadratic term and also the second derivative, which tells us the concavity: whether the graph of the parabola opens up or down. The value of b is the coefficient of the linear term. The value of c is the constant term and also the y-intercept of the parabola.]
- An exponential equation has the form g(x) = cdx. [c is a constant scaling factor, and d is the base – note that we can rewrite as g(x) = celn(d)x, where e is the constant that is approximately 2.718 and ln is the logarithm with base e]
If there is no exponential term (that is, no exponent that contains a variable), then the equation is not exponential.
If there is any power of x other than 2 (quadratic term), 1 (linear term), or 0 (constant term), then the equation is not quadratic. If there is now power of 2 (quadratic term), then the equation is not quadratic.
Let’s look at some examples of each type of equation.
Example 1: A Quadratic Equation
Consider the equation f(x) = 2x2 – 12x + 16
This equation is quadratic since it has the form ax2 + bx + c (a = 2, b = -12, c = 16).
Example 2: An Exponential Equation
Consider the equation f(x) = 2*3x.
This equation is exponential since it has the form cdx (c = 2 is the constant scaling factor, and d = 3 is the base).
Note that there is no linear term (there is no term with a variable in the exponent].
Example 3: An Equation That Is Neither Quadratic Nor Exponential
Consider the equation f(x) = 2x + 5.
This equation is linear since it has the form ax + b (a = 2 is the slope, and b = 5 is the y-intercept).
Note that there is no quadratic term (there is no term with an x2] and no exponential term.
How Do You Know If A Table Is Quadratic Or Exponential?
To tell if a table of x and y values represents a quadratic or exponential graph, add some columns to the table:
- First differences of x
- First differences of y
- Slope – that is, the ratio of: (first differences of y) / (first differences of x)
Now, examine the entries in the slope column to determine they type of function that the data represents:
- If the entries in the slope column increase by the same value each time, then the data in the table represents a quadratic function.
- If the entries in the slope column increase by the same percentage (ratio) each time, then the data in the table represents an exponential function.
- If neither of these are true, then the data in the table represents some other type of function. For example, If the entries in the slope column are constant, then the data in the table represents a linear function.
Let’s look at some examples.
Example 1: Table Of Values For A Quadratic Function
Consider the following table of values:
| x | y |
|---|---|
| 0 | 1 |
| 2 | 5 |
| 4 | 17 |
| 6 | 37 |
| 8 | 65 |
| 10 | 101 |
| 12 | 145 |
| 14 | 197 |
We can add 3 columns to the table: first differences of x, first differences of y, and slope – that is, the ratio of (first differences of y) / (first differences of x):
| x | y | First Differences of x | First Differences of y | Slope |
|---|---|---|---|---|
| 0 | 1 | |||
| 2 | 5 | 2 | 4 | 2 |
| 4 | 17 | 2 | 12 | 6 |
| 6 | 37 | 2 | 20 | 10 |
| 8 | 65 | 2 | 28 | 14 |
| 10 | 101 | 2 | 36 | 18 |
| 12 | 145 | 2 | 44 | 22 |
| 14 | 197 | 2 | 52 | 26 |
Since the slope increases by the same amount (plus 4) each time, we know that we have a quadratic function. In fact, its equation is y = x2 + 1.
Example 2: Table Of Values For An Exponential Function
Consider the following table of values:
| x | x |
|---|---|
| 0 | 5 |
| 1 | 10 |
| 2 | 20 |
| 3 | 40 |
| 4 | 80 |
| 5 | 160 |
| 6 | 320 |
We can add 3 columns to the table: first differences of x, first differences of y, and slope – that is, the ratio of (first differences of y) / (first differences of x):
| x | y | First Differences of x | First Differences of y | Slope |
|---|---|---|---|---|
| 0 | 5 | |||
| 1 | 10 | 1 | 5 | 5 |
| 2 | 20 | 1 | 10 | 10 |
| 3 | 40 | 1 | 20 | 20 |
| 4 | 80 | 1 | 40 | 40 |
| 5 | 160 | 1 | 80 | 80 |
| 6 | 320 | 1 | 160 | 160 |
Since the slope increases by the same ratio (times 2) each time, we know that we have an exponential function. In fact, its equation is y = 5*2x.
Example 3: Table Of Values For A Linear Function
Consider the following table of values:
| x | y |
|---|---|
| 0 | 2 |
| 1 | 5 |
| 2 | 8 |
| 3 | 11 |
| 4 | 14 |
| 5 | 17 |
| 6 | 20 |
| 7 | 23 |
We can add 3 columns to the table: first differences of x, first differences of y, and slope – that is, the ratio of (first differences of y) / (first differences of x):
| x | y | First Differences of x | First Differences of y | Slope |
|---|---|---|---|---|
| 0 | 2 | |||
| 1 | 5 | 1 | 3 | 3/1 = 3 |
| 2 | 8 | 1 | 3 | 3/1 = 3 |
| 3 | 11 | 1 | 3 | 3/1 = 3 |
| 4 | 14 | 1 | 3 | 3/1 = 3 |
| 5 | 17 | 1 | 3 | 3/1 = 3 |
| 6 | 20 | 1 | 3 | 3/1 = 3 |
| 7 | 23 | 1 | 3 | 3/1 = 3 |
Since all of the slopes are the same, we know that we have a constant function. In fact, its equation is y = 3x + 2.
How Do You Know If A Graph Is Quadratic Or Exponential?
A graph is from a quadratic function if it has the shape of a parabola, with a vertex (highest or lowest point). The absolute value of the slope gets larger as x gets larger.
The graph below is a quadratic function.
A graph is one of exponential growth if it has a positive and ever-increasing slope (it is convex or concave up, since the second derivative is always positive. The slope gets larger as x gets larger.
The graph below is one of exponential growth. It uses the natural base e ~ 2.718.
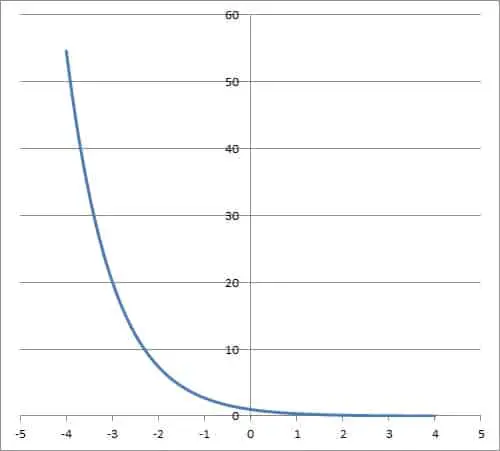
A graph is one of exponential decay if it has a negative and ever-decreasing slope (it is concave or concave up, since the second derivative is always positive. The slope approaches zero as x gets larger.
The graph below is one of exponential decay.
How Do You Know If A Word Problem Is Quadratic Or Exponential?
You can tell if a word problem is quadratic or exponential by paying close attention to the key phrases.
If a word problem mentions that a quantity increases by an increasing amount in every time interval, and the second differences are constant, then use a quadratic function to model the problem.
Some other phrases that suggest quadratic functions are:
- constant second difference
- constant acceleration
If a word problem mentions that a quantity increases by the same percentage (or the same ratio) in every time interval, then use an exponential function to model the problem.
Some other phrases that suggest exponential growth (or decay) are doubling, tripling, halving, percent increase, percent decrease, population growth, bacterial growth, and radioactive decay.
Example 1: Quadratic Function Word Problem
Let’s say that a falling object has a constant acceleration of 32 feet per second. It is dropped from rest at a starting height of 144 feet.
Since the acceleration is -32 feet per second (negative due to falling), the velocity is 0 – 32t (0 because the starting velocity is zero, since the object was dropped from rest).
Since the velocity is -32t, the height is 144 – 32t2/2 = 144 – 16t2 (144 comes from the starting height of 144 feet).
So, the object will hit the ground when the height is zero, or:
- 144 – 16t2 = 0
- 144 = 16t2
- 144/16 = t2
- 9 = t2
- 3 = t (since time should be positive)
At t = 3 seconds, the dropped object will hit the ground.
Example 2: Exponential Function Word Problem
Let’s say that we have $100 in a savings account at the bank, and it grows at a constant rate of 2% per year. Write a function to tell us how much money we have in the savings account after Y years.
This is a compound interest problem. Since our growth rate is a constant percentage increase (2% per year), we will use an exponential function to model this scenario.
Our exponential function has the form
- A = cdY
Where A is the savings account balance at time Y, Y is the time in years, c is a constant scaling factor, and d is the growth rate.
Since our growth is a constant 2% per year (0.02 as a decimal), we use d = 1 + 0.02 = 1.02 as our growth rate. This gives us:
- A = c(1.02)Y
Now we just need to find the value of c. Remember that we started with $100 in the bank account at time Y = 0 years, which gives us:
- 100 = c(1.02)0
- 100 = c(1) [a number raised to the power of zero equals 1]
- 100 = c
So, we can write the full exponential equation:
- A = 100(1.02)Y
So after 10 years, we will have a savings account balance of A = 100(1.02)10 = $121.90.
Conclusion
Now you know the difference between quadratic and exponential functions. You also know the answers to some common questions about how to tell them apart.
You can learn how to find the formula of an exponential function here.
You can learn about the differences between linear and quadratic functions here.
You can also learn about the difference between linear and exponential functions here.