
Sometimes we get a table of values from an experiment or a data set, rather than a picture of the information. Often, we can examine in the information from a function table to learn more about how to model the data.
So, what is a function table? A function table has rows and columns that show input and output values for a function. We can use a function table to find ordered pairs and plot those points to sketch a graph of the function. We can also calculate differences to help us find out what type of function is given in a table.
Of course, there are all sorts of functions that we can represent with a function table, including constant, linear, quadratic, and exponential functions.
In this article, we’ll talk about function tables and look at some examples. We’ll also look at how to figure out what type of function we have based on graphing or looking at the data in a function table.
Let’s get started.
What Is A Function Table?
A function table shows us values (ordered pairs) for a given function.
*Note: we could also have a function table with ordered triples, ordered quadruples, and so forth for a function of 2, 3, or more variables!
A function table has rows and columns, which contain the input and output values of the function, side-by-side.
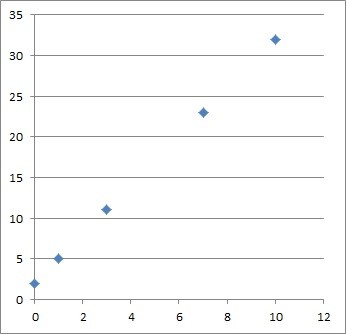
You can see an example of a function table below.
| x | y |
|---|---|
| 0 | 2 |
| 1 | 5 |
| 3 | 11 |
| 7 | 23 |
| 10 | 32 |
We can read a function table to find ordered pairs. For example, we get the following set of ordered pairs from the function table above:
- (0, 2)
- (1, 5)
- (3, 11)
- (7, 23)
- (10, 32)
Now we can plot those points to get an idea of what the function looks like:
If we have enough data (or we know what type of function we have), we can sketch a graph of the function.
We can also calculate differences (for both x and y) to help us find out what type of function is given in a table (more on this later).
What Is The Rule Of A Function Table?
The rule of a function table simply tells you how the two variables (input and output) from the table are related to each other.
For example, the table below has the rule “y is equal to 2 times x”:
| x | y |
|---|---|
| 0 | 0 |
| 1 | 2 |
| 2 | 4 |
| 3 | 6 |
| 4 | 8 |
We can see that in every row, the value of y is twice the value of x. In other words, we double x (the input) to find y (the output).
How Do You Find The Function In A Table?
There are two methods that can help us to find the function in a table:
- Graphing (plot all of the ordered pairs from the function table, sketch a graph, and match the shape to a function type that we are familiar with).
- Differences (find the first differences of x in the table, and then find the first differences of y and second differences of y, and take ratios to see how the function values and slopes change).
Let’s look at some examples of how to find the function in a table (using both methods).
Example 1: Table That Is Not A Function
Consider the table below:
| x | y |
|---|---|
| 0 | -1 |
| 1 | 2 |
| 1 | 5 |
| 2 | 8 |
| 3 | 9 |
We can see right away that this table is not from a function, since the input of x = 1 has two possible outputs: y = 2 and y = 5.
This ambiguity of outputs means that the table is giving us a relation that is not a function. We can verify this with a graph of the ordered pairs in the table.
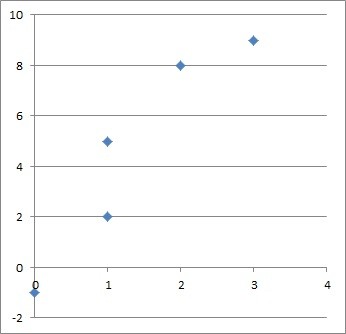
The vertical line x = 1 would intersect the graph more than once, so the graph of the relation fails the vertical line test (meaning it is not a function).
(You can learn more about the vertical line test and what cannot be a function here).
Example 2: Constant Function Table
Consider the table below:
| x | y |
|---|---|
| 1 | 6 |
| 3 | 6 |
| 4 | 6 |
| 6 | 6 |
| 9 | 6 |
No matter the value of x (input), we get the same value of y = 6 as our output. This suggests that we have a constant function from the table.
The graph is a horizontal line at y = 6, pictured below.
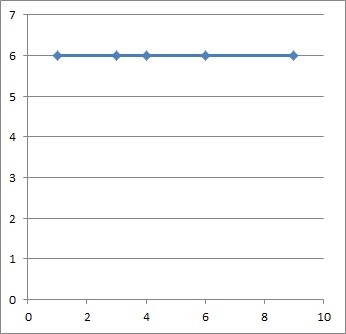
Note that any differences we take for y would give us zero, which also suggests a constant function.
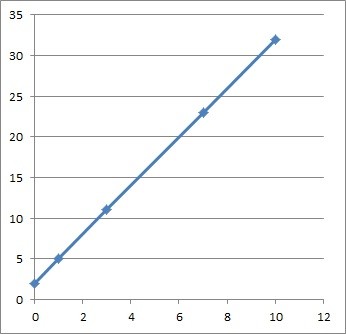
Example 3: Linear Function Table
Consider the table below:
| x | y |
|---|---|
| 1 | 5 |
| 4 | 11 |
| 6 | 15 |
| 7 | 17 |
| 9 | 21 |
It looks like we have a function, but it is not constant (since there are different y values in the table). So, we add columns to look at differences for x and y in the table.
To get first differences for x, we simply subtract the “next” x-value from the “current” x-value. We do the same for y-values to get first differences for y.
You can see the updated table below, which includes first differences for x and first differences for y, along with quotients (first differences of y divided by first differences for x):
| x | y | First Diff x | First Diff y | Quotient (Diff y / Diff x) |
|---|---|---|---|---|
| 1 | 5 | |||
| 4 | 11 | 3 | 6 | 2 |
| 6 | 15 | 2 | 4 | 2 |
| 7 | 17 | 1 | 2 | 2 |
| 9 | 21 | 2 | 4 | 2 |
Note that the quotients in the table above all have the same value. This suggests that we have a linear function in the table.
We can verify this by graphing the ordered pairs in the table – you can see the graph below:
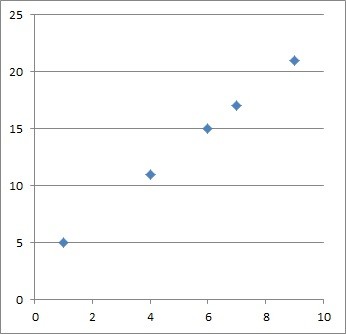
Based on the graph, it looks like we get a linear function of y = 2x + 3. We can verify this equation by choosing two points (ordered pairs) from the table and doing calculations:
Looking at the points (4, 11) and (6, 15), we get:
- Slope = Rise / Run
- m = (y2 – y1) / (x2 – x1)
- m = (15 – 11) / (6 – 4)
- m = 4 / 2
- m = 2
The slope-intercept form for the equation for a line is y = mx + b. We know m = 2, and we can use the point (4, 11) to find b:
- y = mx + b
- y = 2x + b [we found a slope of m = 2 above]
- 11 = 2(4) + b [we used the point (4, 11), so x = 4 and y = 11]
- 11 = 8 + b
- 3 = b
So, the y-intercept of this line is b = 3.
This gives us a line equation of y = 2x + 3. All of the ordered pairs in the table fit this equation.
Example 4: Quadratic Function Table
Consider the table below:
| x | y |
|---|---|
| 1 | 6 |
| 3 | 14 |
| 4 | 21 |
| 6 | 41 |
| 9 | 86 |
It looks like we have a function, but it is not constant (since there are different y values in the table). So, we add columns to look at differences for x and y in the table.
We use the same procedure as in the last example to find first differences for both x and y.
You can see the updated table below, which includes first differences for x and first differences for y, along with quotients (first differences of y divided by first differences for x):
| x | y | First Diff x | First Diff y | Quotient (Diff y / Diff x) |
|---|---|---|---|---|
| 1 | 6 | |||
| 3 | 14 | 2 | 8 | 4 |
| 4 | 21 | 1 | 7 | 7 |
| 6 | 41 | 2 | 20 | 10 |
| 9 | 86 | 3 | 45 | 15 |
Note that the quotients in the table above do not have the same value. This suggests that we do not have a linear function in the table.
We can try to see what type of function we have by graphing the ordered pairs in the table – you can see the graph below:
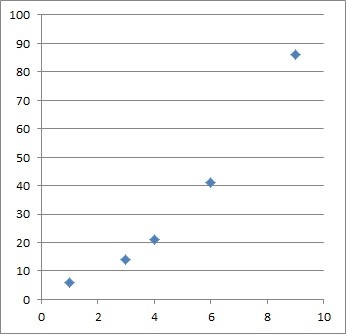
It turns out that the equation is given by y = x2 + 5. All of the values in the table fit this equation.
*Note: to find this equation, all we need to do is choose 3 points (ordered pairs) from the table. Then, plug each set of points into the equation
- y = ax2 + bx + c (a quadratic in standard form)
This would give us a set of 3 equations with 3 unknowns (a, b, and c), which we could solve using algebra.
Example 5: Exponential Function Table
Consider the table below:
| x | y |
|---|---|
| 0 | 3 |
| 1 | 6 |
| 3 | 24 |
| 4 | 48 |
| 6 | 192 |
It looks like we have a function, but it is not constant (since there are different y values in the table). So, we add columns to look at differences for x and y in the table.
We use the same procedure as in the last example to find first differences for both x and y.
You can see the updated table below, which includes first differences for x and first differences for y, along with quotients (first differences of y divided by first differences for x):
| x | y | 1st Diff x | 1st Diff y | Quotient (Diff y / Diff x) |
|---|---|---|---|---|
| 0 | 3 | |||
| 1 | 6 | 1 | 3 | 3 |
| 3 | 24 | 2 | 18 | 9 |
| 4 | 48 | 1 | 24 | 24 |
| 6 | 192 | 2 | 144 | 72 |
Note that the quotients in the table above do not have the same value. This suggests that we do not have a linear function in the table.
So, we will graph the points from the table to get an idea of what the function looks like – you can see the graph below:
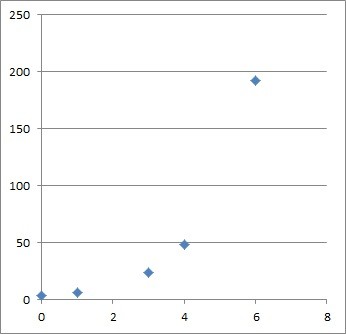
It appears that the function may be exponential, which has the form
- y = abx
with a not zero and b not equal to 0 or 1.
We can use 2 points from the table to get 2 equations and then solve the system to find a and b.
The first point, (3, 24), gives us the equation:
- y = abx
- 24 = ab3
The second point, (4, 48), gives us the equation:
- y = abx
- 48 = ab4
We will divide the two equations to cancel a and solve for b.
On the left side, we get 48 / 24 = 2.
On the right side, we get ab4 / ab3 = b.
So, b = 2.
Then our equation looks like this:
- y = a*2x
Now we just need to find the value of a. We can use either of the points above, but let’s choose (3, 24), which has smaller numbers.
Plugging in x = 3, y = 24 gives us:
- y = a*2x
- 24 = a*23
- 24 = a*8
- 3 = a
Now that we know a = 3 and b = 2, we can write the exponential function:
- y = 3*2x
Note: if the exponential function had the form y = abx + c, then the first differences in the table would give us another exponential function, and we could use three points and solve a system of three equations instead (to solve for a, b, and c). You can learn more here.
Conclusion
Now you know what a function table is and how to figure out what function you have in a given table.
You can find answers to common questions about functions here.
I hope you found this article helpful. If so, please share it with someone who can use the information.

Don’t forget to subscribe to our YouTube channel & get updates on new math videos!