
Exponential functions are widely used in science, math, economics, and other disciplines. An exponential function has certain traits that distinguish it from others (such as linear or quadratic functions).
So, what is an exponential function? An exponential function has the form f(x) = abx, where a and b are real numbers, a is not zero, and b > 0 (a is the coefficient, b is the base, and x is the exponent). For b > 1, f(x) increases by a factor of b when x increases by 1. For b < 1, f(x) decreases by a factor of b when x increases by 1.
Remember that an exponential function with a faster growth rate (larger value of b) will always eventually outpace the growth of another exponential function with a slower growth rate (smaller value of b).
In this article, we will talk about what an exponential function is and how the values of a and b affect the appearance of the graph. We will also take a look at some examples to make the concept clear.
Let’s get started.
What Is An Exponential Function?
An exponential function is one with the form:
- f(x) = abx
where a and b are real numbers, and b is positive (b > 0). We call a the coefficient and b the base of the exponential function.
Note that if b = 1, we have a “trivial” case, since bx = 1x = 1 for all x, and so f(x) = a in this case (a constant function).
Remember that to graph an exponential function, we replace f(x) with y and treat y as the dependent variable (on the vertical axis), while x is graphed on the horizontal axis.
It is also important to note that an exponential function increases or decreases by the same factor (or the same percentage) in a given interval width.
Example: The Exponential Function f(x) = 2x
The exponential function f(x) = 2x has a = 1 and b = 2.
In each interval of width 1, the function increases by a factor of 2 (increases by 100%).
For instance, at x = 3, the function has a value of f(3) = 23 = 8.
At x = 4, the function has a value of f(4) = 24 = 16. This is an increase by a factor of 2 (16 / 8 = 2).
The table below shows how the function doubles in every interval of width 1.
| x | f(x) |
|---|---|
| -1 | 1/2 |
| 0 | 1 |
| 1 | 2 |
| 2 | 4 |
| 3 | 8 |
| 4 | 16 |
exponential function f(x) doubles
over every interval of width 1.
Note that:
- over any interval of width 2, the function increases by a factor of 22 = 4.
- over any interval of width 3, the function increases by a factor of 23 = 8.
- over any interval of width 4, the function increases by a factor of 24 = 16.
- over any interval of width n, the function increases by a factor of 2n.
Effects Of The Coefficient & Base On The Graph Of An Exponential Function
For an exponential function f(x) = abx, the values of a and b will determine the basic shape of the graph.
If a is positive (a > 0), the graph is above the x-axis. If a is negative (a < 0), the graph is below the x-axis.
If b > 1, we have exponential growth, and the absolute value of y increases as x increases.
If b < 1, we have exponential decay, and the absolute value of y decreases as x increases.
This gives us four basic cases, summarized in the table below.
| Values of a and b | a > 0 | a < 0 |
|---|---|---|
| b > 1 | exponential growth function above the x axis | exponential growth function below the x axis |
| b < 1 | exponential decay function above the x axis | exponential decay function below the x axis |
function you will get for various values of a and b.
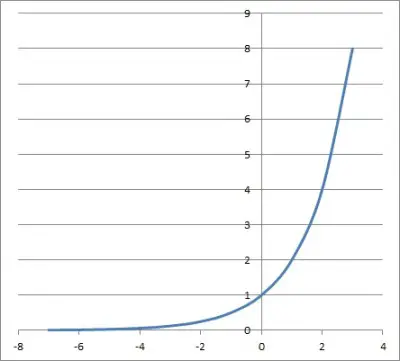
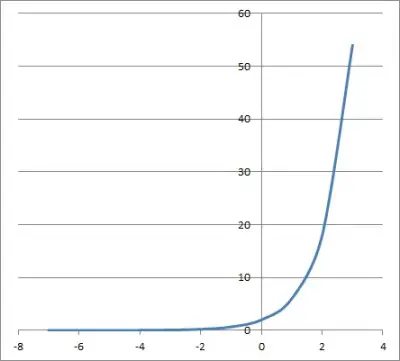
Case 1: a > 0 and b > 1
In this case, we have an exponential growth function that lies above the x-axis.
Its graph looks something like this:
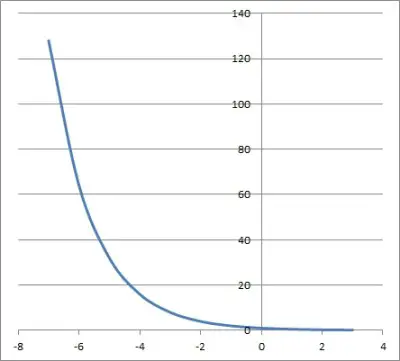
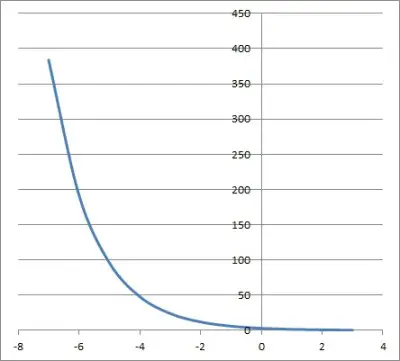
Case 2: a > 0 and b < 1
In this case, we have an exponential decay function that lies above the x-axis.
Its graph looks something like this:
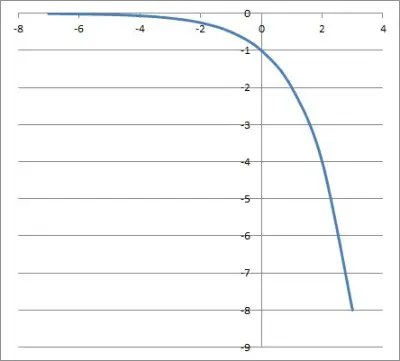
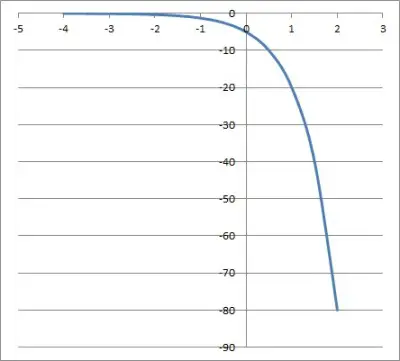
Case 3: a < 0 and b > 1
In this case, we have an exponential growth function that lies below the x-axis.
Its graph looks something like this:
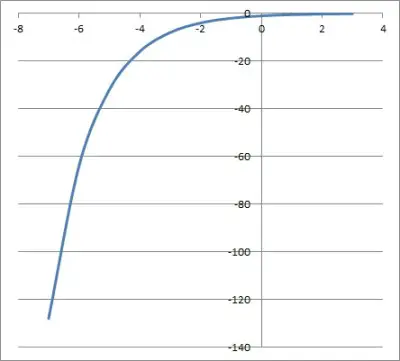
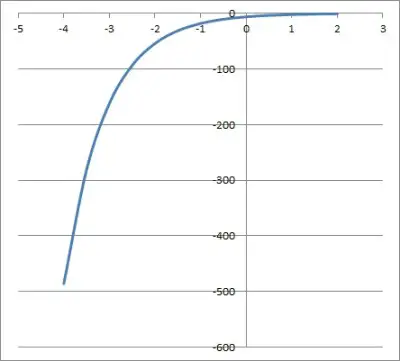
Case 4: a < 0 and b < 1
In this case, we have an exponential decay function that lies below the x-axis.
Its graph looks something like this:
Examples Of Exponential Functions & Their Graphs
Here are some examples of exponential functions and their graphs, along with how to get started with graphing by finding a few points.
Example 1: The Exponential Function f(x) = 2*3x
This is an exponential function that matches case 1 above (a = 2, b = 3). So, we already know the basic shape of the function.
If we can find a few points on the graph to plot, we can sketch the rest of the graph accordingly.
An easy way to find a few points for graphing an exponential function is to use a table of values.
Some easy values to use in this case are x = 0, x = 1, and x = -1. We can use the function f(x) to calculate:
- f(-1) = 2*3-1 = 2/3
- f(0) = 2*30 = 2*1 = 2
- f(1) = 2*31 = 2*3 = 6
You can see these x values (and the corresponding y-values) in the table below.
| x | f(x) |
|---|---|
| -1 | 2/3 |
| 0 | 2 |
| 1 | 6 |
gives us some points to
help us begin graphing f(x).
After plotting these three points on our graph, we can sketch the rest of the function to match the general shape and to intersect these three points:
Example 2: The Exponential Function f(x) = 3*(1/2)x
This is an exponential function that matches case 2 above (a = 3, b = ½). So, we already know the basic shape of the function.
If we can find a few points on the graph to plot, we can sketch the rest of the graph accordingly.
An easy way to find a few points for graphing an exponential function is to use a table of values.
Some easy values to use in this case are x = 0, x = 1, and x = -1. We can use the function f(x) to calculate:
- f(-1) = 3*(1/2)-1 = 3*2 = 6
- f(0) = 3*(1/2)0 = 3*1 = 3
- f(1) = 3*(1/2)1 = 3*(1/2) = 3/2
You can see these x values (and the corresponding y-values) in the table below.
| x | f(x) |
|---|---|
| -1 | 6 |
| 0 | 3 |
| 1 | 3/2 |
gives us some points to
help us begin graphing f(x).
After plotting these three points on our graph, we can sketch the rest of the function to match the general shape and to intersect these three points:
Example 3: The Exponential Function f(x) = -5*4x
This is an exponential function that matches case 3 above (a = -5, b = 4). So, we already know the basic shape of the function.
If we can find a few points on the graph to plot, we can sketch the rest of the graph accordingly.
An easy way to find a few points for graphing an exponential function is to use a table of values.
Some easy values to use in this case are x = 0, x = 1, and x = -1. We can use the function f(x) to calculate:
- f(-1) = -5*(4)-1 = -5*(1/4) = -5/4
- f(0) = -5*(4)0 = -5*1 = -5
- f(1) = -5*(4)1 = -5*4 = -20
You can see these x values (and the corresponding y-values) in the table below.
| x | f(x) |
|---|---|
| -1 | -5/4 |
| 0 | -5 |
| 1 | -20 |
gives us some points to
help us begin graphing f(x).
After plotting these three points on our graph, we can sketch the rest of the function to match the general shape and to intersect these three points:
Example 4: The Exponential Function f(x) = -6*(1/3)x
This is an exponential function that matches case 4 above (a = -6, b = 1/3). So, we already know the basic shape of the function.
If we can find a few points on the graph to plot, we can sketch the rest of the graph accordingly.
An easy way to find a few points for graphing an exponential function is to use a table of values.
Some easy values to use in this case are x = 0, x = 1, and x = -1. We can use the function f(x) to calculate:
- f(-1) = -6*(1/3)-1 = -6*3= -18
- f(0) = -6*(1/3)0 = -6*1= -6
- f(1) = -6*(1/3)1 = -6*(1/3)= -2
You can see these x values (and the corresponding y-values) in the table below.
| x | f(x) |
|---|---|
| -1 | -18 |
| 0 | -6 |
| 1 | -2 |
gives us some points to
help us begin graphing f(x).
After plotting these three points on our graph, we can sketch the rest of the function to match the general shape and to intersect these three points:
Conclusion
Now you know what an exponential function is and what it looks like in the four basic cases (depending on the sign of the coefficient a and the base b).
You can learn how to find the domain and range of an exponential function here.
You can learn more about the natural base e ~ 2.718 here.
I hope you found this article helpful. If so, please share it with someone who can use the information.

Don’t forget to subscribe to our YouTube channel & get updates on new math videos!