
Exponential growth often comes up in math courses (like calculus) and the sciences (such as biology). It pays to be familiar with this concept and what it means in various contexts.
So, what is exponential growth? Exponential growth means that a number increases by a fixed percentage in each time period. For example, exponential growth of 10% per year for a starting value of 1,000 means the value is 1,100 at the end of year 1, then 1,210 at the end of year 2, then 1,331 at the end of year 3, and so forth.
Of course, we can solve for various numbers in an exponential growth problem, including time, starting amount, ending amount, and growth rate (as a percentage).
In this article, we’ll talk about exponential growth and what it means. We’ll also look at some examples and show how to solve them.
Let’s get started.
What Is Exponential Growth?
Exponential growth means that a quantity gets larger over time, increasing by a fixed percentage in each time period (the time periods all have the same duration – for example, 1 day, 1 month, or 1 year).
More specifically, we have a growth rate R (as a percentage) that tells us how much the number grows in each time period. R is also called the exponential growth constant (when used with a base of e).
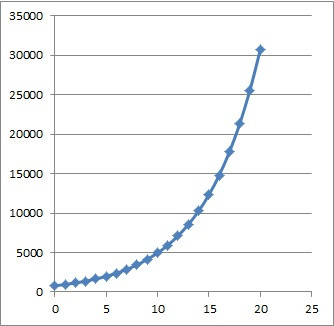
For example, an exponential growth rate of R = 20% per year for a starting value of 5,000 means:
- In the 1st year, the value increases by 1,000 (20% of 5,000), going from 5,000 to 6,000.
- In the 2nd year, the value increases by 1,200 (20% of 6,000), going from 6,000 to 7,200.
- In the 3rd year, the value increases by 1,440 (20% of 7,200), going from 7,200 to 8,640.
- In the 4th year, the value increases by 1,728 (20% of 8,640), going from 8,640 to 10,368.
- and so on.
Note that although the quantity remaining increases by the same percentage in each time interval (20%), it increases by larger amounts in each interval (first an increase of 1,000, followed by an increase of 1,200, then 1,440, 1,728, etc.)
This is because there is more after each year passes, so 20% of the new amount is a larger number each year. The following table illustrates this:
| Year | Start Amount | End Amount | Increase |
|---|---|---|---|
| 1 | 5000 | 6000 | 1000 |
| 2 | 6000 | 7200 | 1200 |
| 3 | 7200 | 8640 | 1440 |
| 4 | 8640 | 10368 | 1728 |
| 5 | 10368 | 12442 | 2074 |
of 20% per year over a 5-year period,
starting with an initial amount of 5,000.
Also, the graph below shows exponential growth from the above example, modeled over 20 years:
Note that we can also write an equation for exponential growth:
- Q(T) = Q0(1 + R)T
where
- T= the time that has passed (usually we start at T = 0)
- R = the rate of growth, usually expressed as a percentage (that is, the exponential growth constant)
- Q(t) = the quantity (amount remaining) at time T
- Q0 = Q(0) = the quantity at time t = 0 (that is, the initial quantity or starting amount)
For the example above, our starting amount was Q0 = 5,000 and the rate of growth R was R = 0.20 (20% per year), so our equation would be:
- Q(T) = 5,000(1 + 0.2)T
- Q(T) = 5,000(1.2)T
So, we can use an exponential function to model exponential growth.
Does Exponential Growth Have A Carrying Capacity?
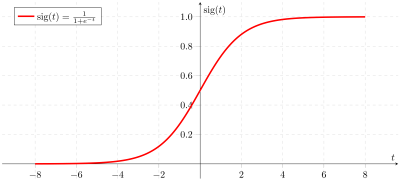
A true exponential growth function does not have an upper limit – it grows without bound. However, in the real world, there are constraints on growth (limited resources).
In these cases, a logistic function is a better model, since includes a carrying capacity (upper limit), which is built into the model.
No matter the starting amount Q0 or the rate of growth R, exponential function graphs all have the same basic shape – they start off with a gentle, almost flat slope with their initial increase, and then shoot off to a steep incline as time goes by.
How To Graph Exponential Growth
To graph exponential growth from the formula, all we need to do is to pick a few times (values of T) and plug them in to the formula. Then, we can graph the points we get and sketch an exponential growth curve to connect the dots.
Let’s look at an example to see how it works.
Example: Graphing Exponential Growth
Let’s say that you start with a population of 800 people in a town. Over time, new people arrive in town to give it a growth at a rate of 10% per year.
So, our exponential growth formula has Q0 = 800 and R = 0.10, and it looks like this:
- Q(T) = 800(1.1)T
Let’s choose the following values of T to plug in:
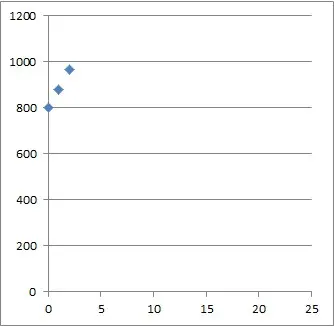
- T = 0 gives us Q(0) = 800 (we can read this right from the function, since Q0 = 800).
- T = 1 gives us Q(1) = 800(1.1)1 = 880
- T = 2 gives us Q(2) = 800(1.1)2 = 968
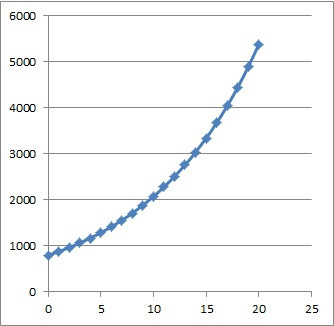
- T = 20 gives us Q(20) 800(1.1)20 = 5,382
So, the first three points for us to graph are (0, 800), (1, 880), and (2, 968):
After plotting these three points, we can connect them by sketching an exponential growth curve, as shown below:
Examples Of Exponential Growth
Examples of exponential growth include:
- Population increase (due to birth or immigration outpacing deaths)
- Appreciation (houses, investments, businesses)
- Bacteria (including doubling time, or the time it takes for the population to increase by 100%)
Let’s look at how to solve some examples like the ones mentioned here.
How To Solve Exponential Growth Problems
To solve an exponential growth problem, there will be 3 basic steps:
- Step 1: Identify the values from the equation that we have (we should have 3 out of 4 of: T, R, Q0, and Q(T).
- Step 2: Write out the equation Q(T) = Qo(1 + R)T and plug in the known values.
- Step 3: Solve for the unknown value using algebra (this usually includes use of logarithms).
Let’s take a look at some examples to see how it works in practice.
Example 1: Exponential Growth Of Population (Population Growth)
Let’s say that you start with a population of 4,000 people in a town. Over time, people arrive in town at a rate that adds 20% per year.
When does the town grow to a population of 6,912 people?

Step 1: our exponential growth formula has values Q0 = 4,000 (starting value for the population) and R = 0.20 (growth rate of 20% expressed as a decimal), and Q(T) = 6,912 (population after some unknown time T).
Step 2: we write out our exponential growth equation:
- Q(T) = Qo(1 + R)T
and then plug in our known values:
- 6,912 = 4,000(1 + 0.2)T
- 6,912 = 4,000(1.2)T
Step 3: now we just need to use some algebra to solve for the value of T:
- 6,912 = 4,000(1.2)T
- 6,912/4,000 = (1.2)T
- log(6,912/4,000) = log(1.2)T
- log(6,912/4,000) = log(1.2)T
- log(6,912/4,000) = Tlog(1.2)
- log(6,912/4,000) / log(1.2) = T
- 3 = T
So, the town will have 6,912 people after 3 years (so, it takes just over 3 years for the population to increase by a factor of 75%).
Example 2: Exponential Growth Of Value (Appreciation)
Let’s say that you buy a new house that has a value of $400,000. Over time, the value of the car increases at a rate of 10% per year.
When will the house worth $644,204?

Step 1: our exponential growth formula has values Q0 = $400,000 (starting value of the house) and R = 0.10 (growth rate of 10% expressed as a decimal), and Q(T) = $644,204 (value of the house after some unknown time T).
Step 2: we write out our exponential growth equation:
- Q(T) = Qo(1 + R)T
and then plug in our known values:
- $644,204 = $400,000(1 + 0.1)T
- $644,204 = $400,000(1.1)T
Step 3: now we just need to use some algebra to solve for the value of T:
- $644,204 = $400,000(1.1)T
- $644,204/$400,000 = 1.1T
- log($644,204/$400,000) = log(1.1T)
- log($644,204/$400,000) = Tlog(1.1)
- log($644,204/$400,000) / log(1.1) = T
- 5 = T
So, the house’s value will increase from $400,000 to $644,204 over the first 5 years of ownership.
We can also easily figure out what the house will be worth after T = 10 years:
- Q(T) = Qo(1 + R)T
- Q(10) = $400,000(1 + 0.1)10
- Q(10) = $400,000(1.1)10
- Q(10) ~ $1,037,497
So the value of the house is over $1 million after 10 years of ownership! Also, the value doubled from $400,000 to $800,000 somewhere between years 7 and 8.
After that, the house will gain about $103,750 of value in the 11th year (compare this to the $40,000 of value gained in the first year!)
Example 3: Exponential Growth Of Bacteria
The doubling time of a certain bacteria is 3 days. How long does it take for 100 bacteria to grow to 6,400 bacteria?
“Doubling time” means the time that it takes the original bacteria colony (Q0) to grow to double its original population. So, it takes 3 days for the initial 100 bacteria to grow to a population of 200 bacteria.
After that:
- It takes another 3 days for the those 200 bacteria to grow to a population of 400 bacteria.
- It takes another 3 days for the those 400 bacteria to grow to a population of 800 bacteria.
- It takes another 3 days for the those 800 bacteria to grow to a population of 1,600 bacteria.
- It takes another 3 days for the those 1,600 bacteria to grow to a population of 3,200 bacteria.
- It takes another 3 days for the those 3,200 bacteria to grow to a population of 6,400 bacteria.
In total, it takes 6*3 = 18 days for 100 bacteria to grow to a population of 6,400.
Note: we could also use the formula from before to find the time T:
- Q(T) = Qo(1 + R)T
- 6,400 = 100(2)T
- 6,400/100 = (2)T
- 64 = 2T
- 26 = 2T
- 6 = T
This means that it takes 6 doubling period, or 6*3 days = 18 days, for the 100 bacteria to grow to a population of 6,400 bacteria.
Can Exponential Growth Continue Forever?
Exponential growth cannot continue forever, since there is always a limit on resources. The question is which resource will run out first. For example:
- Exponential population growth in a town must eventually end due to limits on space.
- Exponential growth in the value of a home must eventually end due to limits on money.
- Exponential growth of a bacteria population must eventually end due to limits on food.

Conclusion
Now you know what exponential growth is and what it looks like on a graph. You also know how to solve these types of problems for each of the key parameters.
You can learn about exponential decay here.
I hope you found this article helpful. If so, please share it with someone who can use the information.

Don’t forget to subscribe to our YouTube channel & get updates on new math videos!