
Probability and statistics are often combined into one course in high school or college classes. However, there are some differences between these two fields.
So, what is the difference between probability & statistics? Probability is a branch of pure mathematics that can be used to make predictions about the future. Statistics is a branch of applied mathematics that summarizes & presents data or analyzes data to find a model to explain what was observed.
Probability is often seen as more “theoretical”, while statistics is seen as applied math.
In this article, we’ll talk about the differences between probability and statistics. We’ll also take a look at how each of them is used.
Let’s get started.
Differences Between Probability & Statistics
The key differences between probability and statistics involve the intent of each one.
Probability is used to calculate the likelihood that an event occurs. It is often used to predict what will happen in the future.

Statistics is used to study data that we collect. We calculate statistics based on a sample from a population to measure data and then try to apply this knowledge to the population as a whole.

The table below summarizes some of the differences between probability and statistics (generally speaking).
| Probability | Statistics |
|---|---|
| Theoretical (“Pure Math”) | Applicable (“Applied Math”) |
| Deduction (Rule->Data) | Induction (Data->Rule) |
| Ideal | Real |
| Certainty | Estimation |
| Predict | Summarize |
| Future | Past |
differences between probability
and statistics.
What Is Probability?
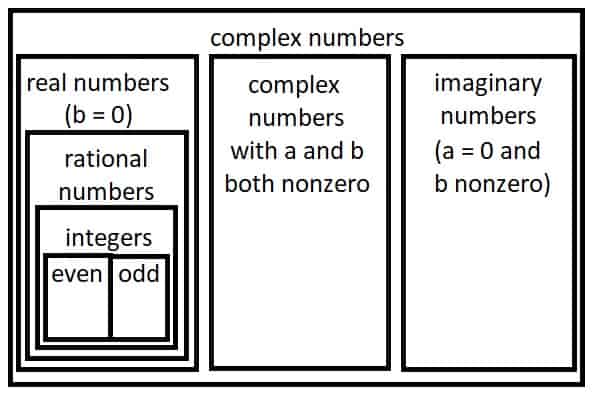
A probability is a number that helps us to quantify how likely an event is. A probability is a number between 0 and 1 (0% to 100%), where 0 means the event is impossible and 1 means the event is guaranteed (so probability can never be greater than 1).
For example, there is a 0% probability of an even number being odd, but there is a 100% probability of an even number being an integer. Likewise, there is a 50% probability of an integer being even.
If we know the probability of one or more events, we can calculate the probability of related or connected events.
For example, if we have a 0.5 probability (50% chance) of flipping heads on a fair coin, then we have a 0.5*0.5 = 0.25 (25% chance) of flipping heads twice in a row on a fair coin. We multiply the probabilities because the two events are independent (the first coin flip does not affect the second coin flip, and vice versa).
The study of probability uses models called distributions that we can use to predict what will occur.
Probability Distributions
There are various probability distributions that are used to model scenarios. Some of these probability distributions include:
- Linear
- Exponential
- Uniform
- Binomial
- Poisson
- Normal
The key is to remember that the total probability is always 1 (100%), which accounts for all possible outcomes.
For example, a discrete uniform distribution that can take values of X = 1, 2, 3, or 4 would have a probability of ¼ or 0.25 (25%) for each of these 4 outcomes. The total probability is ¼ + ¼ + ¼ + ¼ = 1.
For a linear distribution, if X can take on a value between 0 and 4 with probability P(x) = ax + b, then a = 0.1 and b = 0.05 would satisfy a total probability of 1 (the area under the line y = 0.1x + 0.05 from x = 0 to x = 4 is 1).
A normal distribution also has an area of 1 under the curve.

Uses Of Probability
One use of probability is to calculate conditional probability. That is, the probability that an event A will happen, given that event B happens (the notation is P(A|B), or in words, “the probability of A given B”).
The formula for conditional probability is given by:
- P(A|B) = P(AnB) / P(B)
where P(AnB) is the probability that both A and B occur.
Conditional probability lets us use new information to refine our estimates.
For example, let’s say that event A is snow, and event B is an air temperature of 32 degrees Fahrenheit.

From past experience, we know that the chance of snow in Boston on March 1 is 40%. That is, P(A) = 0.4.
However, we may also know that if the temperature on March 1 is 32 degrees Fahrenheit, then the chance of snow is 50%. That is, P(A|B) = 0.5 – the conditional probability that we get snow, given that it is 32 degrees Fahrenheit.
What Is Statistics?
The field of statistics is all about data and everything we do with it: collecting, organizing, analyzing, interpreting, and presenting it. Statistics is also used to describe various measures that we can use to describe a data set.
For example, some common statistics that we can calculate for a data set include:
- Average (arithmetic mean)
- Median
- Mode
- Range
- Interquartile Range (You can learn how to find quartiles in Excel here).
- Standard Deviation
(You can learn about some uses of arithmetic mean in my article here).
Some statistics are measures of center (the first three in the list above). These statistics help us to understand where the middle or center of a data set lies.
Other statistics are measures of dispersion (the last three in the list above). These statistics help us to understand how spread out the data is.
Uses Of Statistics
Statistics has countless applications in many different fields, such as:
- Academia
- Business
- Medicine
- Psychology
- Real Estate
(You can learn about 10 examples of how statistics is used in business here).
For example, in real estate, statistics are used to compare different properties and analyze towns or cities. For example, you can compile statistics about homes:
- Price
- Square Footage
- Bedrooms
- Bathrooms
- Acreage
Let’s say you find out that the average price of a home is $400,000 and the median price is $300,000. That would tell you that:
- 50% of homes are selling for $300,000 or more (by definition of the median).
- 50% of homes are selling for $300,000 or less (again, by definition of the median).
- More than 50% of homes are selling for $400,000 or less (since the mean is higher than the median).

Conclusion
Now you know about the differences between probability and statistics. You also know what each one is used for.
You can learn more about how probability is used in real life in my article here.
You might also want to check out my article on how statistics is used here.
I hope you found this article helpful. If so, please share it with someone who can use the information.
Don’t forget to subscribe to my YouTube channel & get updates on new math videos!
~Jonathon