
Derivatives. One of the main concepts in calculus. Much of calculus depends on derivatives and rates of change.
Typically, derivatives are introduced at the beginning of a calculus course and used throughout.
Suppose we’re given the graph of a function and we want to find the graph of the original function. How will we do that? We’ll look at 4 key steps.
Let’s get started.
Recall: when we first learned about derivatives, we learned that graphically speaking, the derivative of a function can be interpreted as a formula for the slope of the tangent line.
Before we look at the graph of the derivative of a function, let’s look at a few visuals of tangent lines to different curves. In each of the graphs below, a tangent line is drawn to a curve.
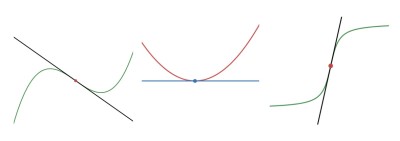
Notice that in the second diagram, the tangent is a horizontal line and it is tangent to the graph at a relative minimum. We’ll use this idea as we work through problems.
A common problem that comes up in calculus class presents this question: given the graph of the derivative, find a possible graph of the original function.
What Does The Graph Of A Derivative Tell You About The Original Function?
Example 1
Let’s start with an easy one:
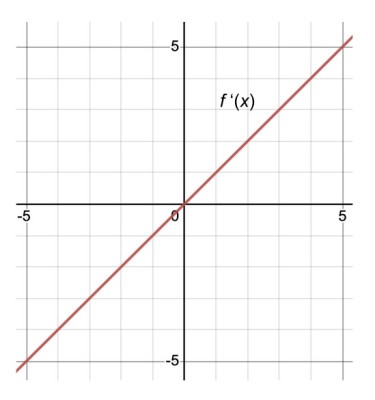
This is the graph of the function y = x. Remember, this graph represents the derivative of a function. Our task is to find a possible graph of the function.
First, notice that the derivative is equal to 0 when x = 0. We know from calculus that if the derivative is 0 at a point, then it is a critical value of the original function.
We can use critical values to find possible maximums and minimums. Also, on the interval (- ∞, 0), f ‘(x) < 0 which means the original function f(x) is decreasing.
On the interval (0, ∞), f ‘(x) > 0, which means the original function f(x) is increasing.
Because the sign of f ‘(x) changes from decreasing to increasing, we have a minimum at x = 0. Let’s summarize in a table:
Sign Analysis Table
| Interval/ Critical Value | (- ∞, 0) | (- ∞, 0) | (0, ∞) |
|---|---|---|---|
| f ‘(x) | negative | f ‘(x) = 0 | positive |
| f (x) | decreasing | relative minimum at x = 0 | increasing |
Great! Now we have some information about the original function.
We can start by plotting the relative minimum at (0, f(x)). For simplicity, we’ll make the minimum at (0, 0). We’ll talk about this more in a bit.
Since our derivative is a linear function, then the original function must be quadratic. This means the minimum (0, 0) is the vertex of a parabola.
But, how do we graph the rest of the function? How narrow or wide should we make the parabola?
We can use the slopes of the tangent lines to figure that out as well. Remember: the y-values of f ‘(x) will tell us the slope of the tangent lines of the original function.
Let’s look at the value of f ‘(x) at various inputs (x-values) in a table to get an idea as to what’s going on here:
| x | f ‘(x) = x |
| -4 | -4 |
| -2 | -2 |
| 0 | 0 |
| 2 | 2 |
| 4 | 4 |
This was pretty easy to determine since we’re given the identity function as the derivative.
On the interval (- ∞, 0), the slopes start out very steep and get less steep as we approach 0.
At the point (0, 0), the tangent line is horizontal, then from (0, ∞), the slopes start out small and then become steeper and steeper.
We can get an idea of what the original function looks like by putting in a few of these slopes. This is called a slope field.
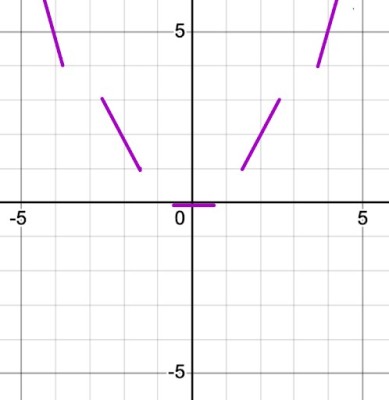
The slopes act as guidelines for our original function. Here is the graph of a possible function:
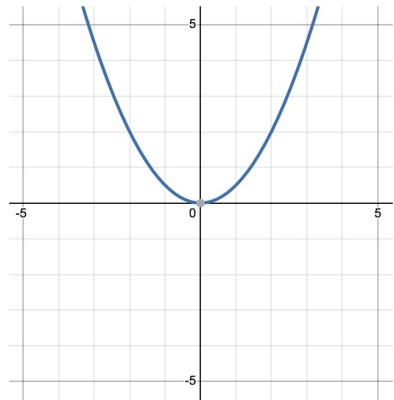
Of course, we can be confident that our graph is correct because our example gave us the equation of the linear function and we can easily integrate that to find the original function.
If f ‘(x) = x, then f(x) = ½x2 (possibly with a constant added) Also, notice that on our graph of f(x), the function is decreasing on (- ∞, 0) and increasing on (0, ∞).
Is this the only graph of a function whose derivative is f ‘(x)= x? No. We know from calculus that there are an infinite number of functions whose derivative is equal to x.
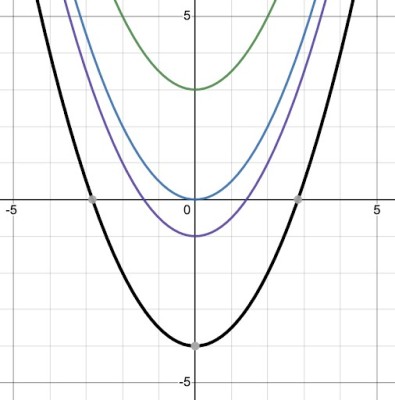
These functions differ by a constant. Graphically, the family of functions whose derivative is equal to x are vertically shifted up or down.
In the diagram below, all of the parabolas shown have the derivative f ‘(x) = x.
Before we move to another problem, let’s answer the question:
What Does The Graph Of A Derivative Tell You About The Original Function?
Using our first example, we’ve discovered the following information.
- The x-intercepts of f ’(x) are possible maximums or minimums of the function.
- If f ’(x) is above the x-axis, then f(x) is increasing. If f ’(x) is below the x-axis, then f(x) is decreasing.
- The y values of f ’(x) give us the slopes of the tangent lines of f(x).
Our first example was relatively straightforward. The derivative graph was linear and the original graph was quadratic.
Not every problem will be that simple. In our next example, we’ll look at a derivative graph of degree 2 to see what we can learn about the original function. Let’s first answer this question:
What Does The Second Derivative Tell You About A Graph?
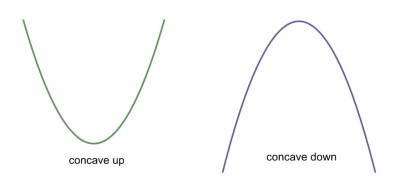
The second derivative tells us about the concavity of the original function.
Let’s talk about the second derivative. Recall that the second derivative tells us about the concavity of the original function.
If f ‘’(x) > 0 on an interval, then the original function f(x) is concave up on that interval. If f ‘’(x) < 0 on an interval, then the original function f(x) is concave down on that interval.
In our next example, we’ll also use the second derivative to learn more information about the original function.
Example 2
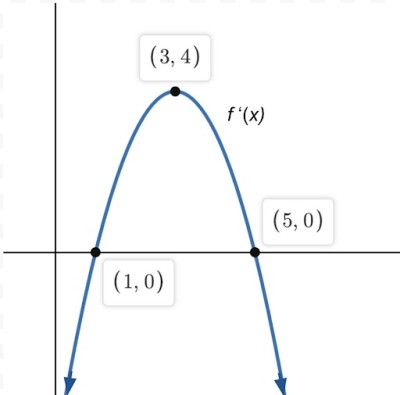
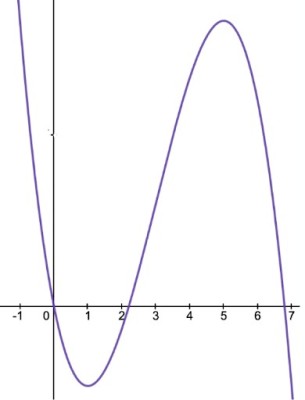
Sketch a possible graph for the function f(x) the graph of its derivative.
Key Steps
- Find the possible maximums and minimums by identifying the x-intercepts of f ‘. From the graph, we see that our x-intercepts are 1 and 5. This means we have possible maximums or minimums at these points.
- Identify the intervals where f ‘ is above the x-axis and below the x-axis. This will tell us where f is increasing or decreasing. We can create a table to do a sign analysis.
Sign Analysis Table
| Interval/ Critical Value | (- ∞, 1) | x = 1 | (1, 5) | x = 5 | (5, ∞) |
|---|---|---|---|---|---|
| f ‘(x) | negative | f ‘(x) = 0 | positive | f ‘(x) = 0 | negative |
| f (x) | decreasing | relative min | increasing | relative max | decreasing |
Also, f ‘(x) is below the x-axis on the intervals from (- ∞, 1) and (5, ∞) which means f(x) is decreasing on these intervals.
Since f ‘(x) is above the x-axis on the intervals from (1, 5) this means f(x) is increasing on that interval.
Since the function goes from decreasing to increasing at x = 1, the function has a relative minimum there.
Similarly, since the function goes from increasing to decreasing at x = 5 , there is a relative maximum at x = 5.
From the table, we see that we have a relative minimum at (1, f(1)) and a relative maximum at (5, f(5). Let’s assume that we don’t know the equation for the derivative function.
That means we can’t integrate it to find a possible function. So, we can just estimate these points.
- Find the slopes of some tangent lines of f using the y values of the derivative. In this case, we aren’t given the scaling of the values on the y-axis so it’s going to be challenging to use the slopes as guidelines for our graph. We’ll skip this step since it’s not particularly helpful here.
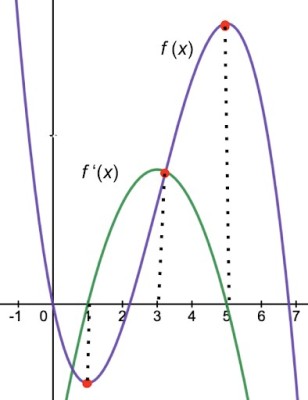
- Use the second derivative f ‘’(x) to learn about the concavity of the original function f(x) and find possible inflection points. Possible inflection points occur at the relative maximums or minimums of f ’(x). In our derivative graph below, we see that at the maximum (3, f(3)), the slopes of the tangent lines on either side of the point have different signs. Remember, the slopes of the tangent of f’(x) are actually the second derivative f’’(x). On the left side of the point (3, f’(3)), we see the slopes of the tangents (in green) are positive; on the right side, the slopes of the tangents (in pink) are negative.
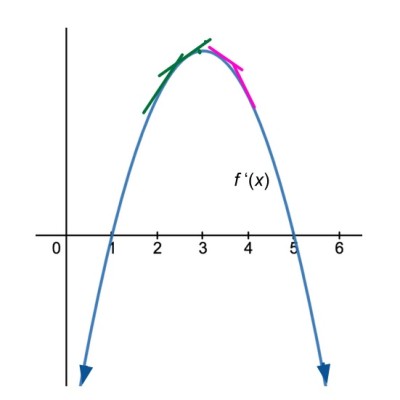
What does this mean? If the second derivative f ‘’(x) changes sign when x = 3, there is a point of inflection at (3, f(3)). We can do a sign analysis as we did with the first derivative to verify that we have a point of inflection:
Sign Analysis of f ‘’(x)
| Interval/ Possible POI (point of inflection) | (- ∞, 3) | (- ∞, 3) | (3, ∞) |
|---|---|---|---|
| f ‘’(x) | positive | f ‘’(x) = 0 | negative |
| f (x) | concave up | point of inflection | concave down |
Indeed, since the sign changes, we have a point of inflection at (3, f(3)). This means that the concavity changes from concave up to concave down at that point.
Putting all of these pieces together, we get the following sketch. Keep in mind, we could vertically shift the graph up or down to get another possible function whose derivative was the given graph.
Notice, if we overlay the derivative (in green) with the possible graph of the original function, we can see the relationships between the derivative and the original function pretty easily.
Let’s look at another problem. As before, we’ll go through our 4 key steps.
Example 3
Given the graph of the derivative and that a point on the original function is (0, 5), sketch the graph of the original function f(x).
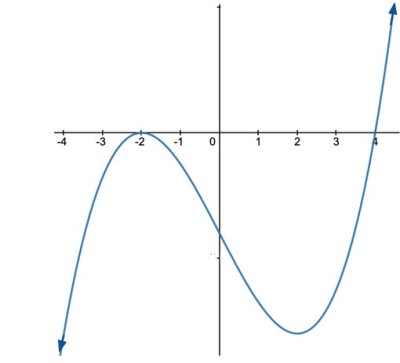
Key Steps
- Find the possible maximums and minimums by identifying the x-intercepts of f ‘. The x-intercepts of f’(x) are -2 and 4.
- Identify the intervals where f ‘ is above the x-axis and below the x-axis. In this case, f’ is below the x-axis from (- ∞, -2) and (-2, 4) and it is above the x-axis from (4, ∞). Let’s use our information from these first two steps to determine the maximums and minimums of the function.
| Interval/ Critical Value | (- ∞, -2) | x = -2 | (-2, 4) | x = 4 | (4, ∞) |
|---|---|---|---|---|---|
| f ‘(x) | negative | f ‘(x) = 0 | negative | f ‘(x) = 0 | positive |
| f (x) | decreasing | no conclusion | decreasing | relative min | increasing |
- Find the slopes of some tangent lines of f using the y values of the derivative. Since we don’t know the scaling on the y-axis, we can skip this step.
- Use the second derivative f ‘’(x) to learn about the concavity of the original function f(x) and find possible points of inflection. Remember, the possible points of inflection occur at the maximums and minimums of f’(x). Looking at our graph, we see that we have a maximum when x = -2 and a minimum when x = 2. When x < -2, the slopes of the tangent lines are positive. On the interval (-2, 2), the tangent lines are negative; on the interval (2, ∞), the tangent lines are positive again. Let’s summarize these findings in a table:
Sign Analysis of f ‘’(x)
| Interval/ Possible POI (points of inflection) | (- ∞, -2) | x = -2 | (-2, 2) | x = 2 | (2, ∞) |
|---|---|---|---|---|---|
| f ‘’(x) | positive | f ‘’(x) = 0 | negative | f ‘’(x) = 0 | positive |
| f (x) | concave up | point of inflection | concave down | point of inflection | concave up |
So, we have points of inflection at (-2, f(-2)) and (2, f(2)). Now, we have a good idea of what the graph of f(x) looks like! Using all of the above information, here is a possible sketch:
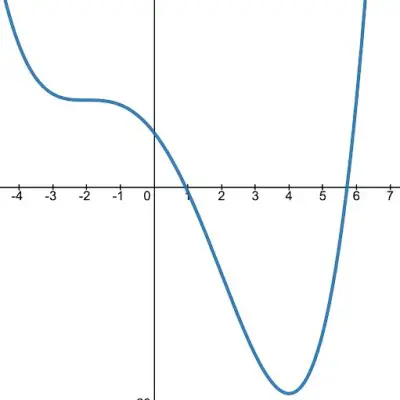
You can find the key points of the above graph of f(x) to match it up with what we found from the derivative. Go ahead and check that everything makes sense!
With practice, you’ll get very used to interpreting the graph of the derivative to determine a graph of the original function!
You can find answers to common questions about functions here.
You can learn about how to use derivatives and graphs to find function maximums here.
I hope you found this article helpful. If so, please share it with someone who can use the information.

Don’t forget to subscribe to our YouTube channel & get updates on new math videos!
About the author:
Jean-Marie Gard is an independent math teacher and tutor based in Massachusetts. You can get in touch with Jean-Marie at https://testpreptoday.com/.