
You will often need to find function minimums in calculus, especially in optimization problems. A function minimum can be local or global (the global one is a local minimum, and it is less than any other local minimums).
So, how do you find a function minimum? To find a function minimum for f(x), find where the 1st derivative f’(x) is zero (critical points). Then, take the 2nd derivative f’’(x) and find the critical points where f’’(x) > 0 (local minimums). Look at the endpoints of an interval to find additional possible local minimums.
Of course, there are a few different ways to find function minimums, but most of the time you will be taking derivatives to do so.
In this article, we’ll talk about ways to find function minimums. We’ll also look at some examples to make the concept clear.
Let’s get started.
How To Find Function Minimums
There are a few different ways to find function minimums for f(x):
- 1st derivative & sigh chart – this involves taking the 1st derivative f’(x) and making a sign chart for f’(x) at various values (between critical points).
- 1st & 2nd derivatives – this involves taking the 1st and 2nd derivatives and finding critical points where f’’(x) is positive.
- Graphing f(x) – this involves graphing f(x) and finding the lowest y-values on the graph. It works best for an interval, or if you already have an idea of where the minimum lies.
Remember that we need to look at y-values of the function at the endpoints to find possible additional local minimums.
Also, there are some functions whose y-values grow larger than any local minimum as x approaches infinity (for example, certain cubic functions).
Let’s take a closer look at each of the three methods to find function minimums, along with some examples to show how they work.
How To Find Function Minimums (First Derivative & Sign Chart)
To find a function minimum with this method, there are a few steps:
- First, take the first derivative f’(x).
- Next, solve the equation f’(x) = 0 to find critical points of f(x).
- Then, make a sign chart for f’(x), finding the values of f’(x) (positive or negative) between the critical points.
- If any critical point has f’(x) < 0 to the left and f’(x) > 0 to the right, then that critical point is a local minimum (because the function decreases to the left of the critical point, and then increases to the right of the critical point).
- Finally, compare the local minimums to find the least one.
- If necessary, compare the y-values of the endpoints as well (when looking at an interval).
Let’s try a couple of examples.
Example 1: How To Find Function Minimums With First Derivative & Sign Chart
Let’s say we want to find the minimums of the function:
- f(x) = 2x3 – 15x2 + 36x – 20
First, we find the derivative function f’(x):
- f’(x) = 6x2 – 30x + 36
Next, we solve the equation f’(x) = 0 to find the critical points:
- f’(x) = 0
- 6x2 – 30x + 36 = 0
- 6(x2 – 5x + 6) = 0
- x2 – 5x + 6 = 0
- (x – 2)(x – 3) = 0
- x = 2 or x = 3
So, our critical values are at x = 2 and x = 3.
Now, we make a sign chart for f’(x) with critical values at x = 2 and x = 3. The signs are as follows:
- Left of x = 2: f’(1) = 6(1)2 – 30(1) + 36 = 6 – 30 + 36 = 12 > 0 (positive)
- Between x = 2 and x = 3: f’(2.5) = 6(2.5)2 – 30(2.5) + 36 = 37.5 – 75 + 36 = -1.5 < 0 (negative)
- Right of x = 3: f’(4) = 6(4)2 – 30(4) + 36 = 96 – 120 + 36 = 12 > 0 (positive)
You can see the sign chart graphed on the number line below:
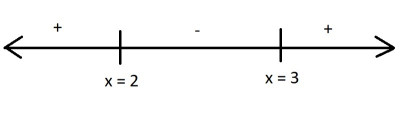
We can see that at x = 2, the derivative f’(x) is positive to the left and negative to the right. This means that f(x) has a local maximum at x = 2.
We can see that at x = 3, the derivative f’(x) is negative to the left and positive to the right. This means that f(x) has a local minimum at x = 3.
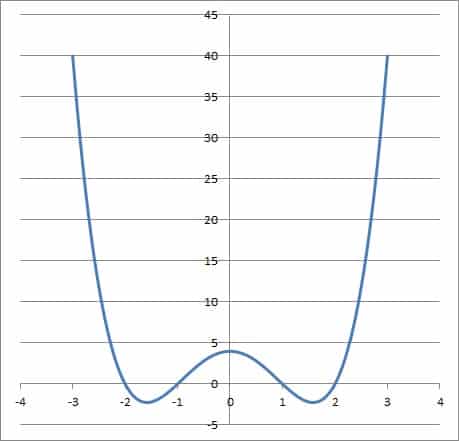
So, the only local minimum is at x = 3, where the function value is 7. However, there is no global minimum, since f(x) grows more negative without bound as x approaches negative infinity.
You can see this on the graph of f(x) below.
Example 2: How To Find Function Minimums With First Derivative & Sign Chart (On An Interval)
Let’s say we want to find the minimums of the function:
- f(x) = 2x3 – 15x2 + 36x – 20
on the interval [1, 4].
The calculations for f’(x) and the sign chart would be the same as in the previous example. However, now we need to look at function values at the endpoints.
At the left endpoint (x = 1), the function value is:
- f(1)
- =2(1)3 – 15(1)2 + 36(1) – 20
- =2 – 15 + 36 – 20
- =3
At the right endpoint (x = 4), the function value is:
- f(4)
- =2(4)3 – 15(4)2 + 36(4) – 20
- =2(64) – 15(16) + 144 – 20
- =128 – 240 + 144 – 20
- =12
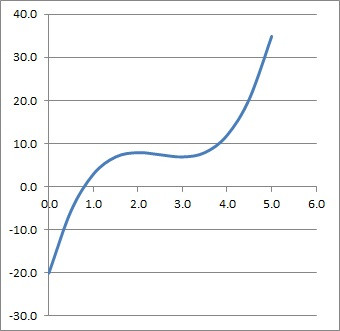
So, it looks like the function has a minimum at the left endpoint x = 1. In fact, the y-value of f(1) = 3 is less than the y-value of f(3) = 7 at the local minimum, so f(1) = 3 is the absolute minimum on the interval [1, 4].
![graph of cubic on interval [1, 4]](https://jdmeducational.com/wp-content/uploads/2022/10/graph-of-cubic-on-interval-1-4.jpg)
How To Find Function Minimums (First & Second Derivative)
Another way to find a function minimum is with the first and second derivatives. Here are the few steps:
- First, take the first derivative f’(x).
- Next, solve the equation f’(x) = 0 to find critical points of f(x).
- Then, take the second derivative f’’(x).
- Now, find out the value of f’’(x) at each critical point of f(x).
- If any critical point has f’’(x) > 0, then that critical point is a local minimum (since f’’(x) > 0 means a concave up function, which has a “valley” when f’(x) = 0).
- Finally, compare the local minimums to find the least one.
- If necessary, compare the y-values of the endpoints as well (when looking at an interval).
Let’s some examples.
Example 1: How To Find Function Minimums With First Derivative & Second Derivative
Let’s say we want to find the minimums of the function:
- f(x) = x3 – 9x2 + 24x – 10
First, we find the derivative function f’(x):
- f’(x) = 3x2 – 18x + 24
Next, we solve the equation f’(x) = 0 to find the critical points:
- f’(x) = 0
- 3x2 – 18x + 24 = 0
- 3(x2 – 6x + 8) = 0
- x2 – 6x + 8 = 0
- (x – 2)(x – 4) = 0
- x = 2 or x = 4
So, our critical values are at x = 2 and x = 4.
Now, we take the second derivative function f’’(x):
- f’’(x) = 6x – 18
Next, we find the value of the second derivative function f’’(x) at the critical points.
For x = 2, we get:
- f’’(2) = 6x – 18
- f’’(2) = 6(2) – 18
- f’’(2) = 12 – 18
- f’’(2) = -6
So f’’(2) is negative, which means that f(x) has a local maximum at x = 2.
For x = 4, we get:
- f’’(4) = 6x – 18
- f’’(4) = 6(4) – 18
- f’’(4) = 24 – 18
- f’’(4) = 6
So f’’(4) is positive, which means that f(x) has a local minimum at x = 4.
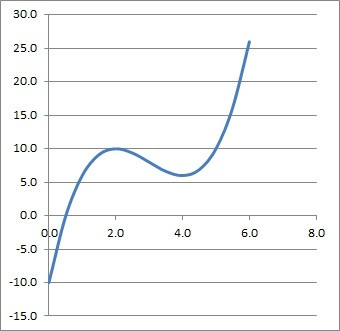
So, the only local minimum is at x = 4, where the function value is 6. However, there is no global minimum, since f(x) grows more negative without bound as x approaches negative infinity.
You can see this on the graph of f(x) below.
Example 2: How To Find Function Minimums With First Derivative & Second Derivative (On An Interval)
Let’s say we want to find the minimums of the function:
- f(x) = x3 – 9x2 + 24x – 10
on the interval [0, 10].
The calculations for f’(x) and f’’(x) would be the same as in the previous example. However, now we need to look at function values at the endpoints.
At the left endpoint (x = 0), the function value is:
- f(0)
- = 03 – 9(0)2 + 24(0) – 10
- =-10
At the right endpoint (x = 10), the function value is:
- f(10)
- = 103 – 9(10)2 + 24(10) – 10
- 1000 – 900 + 240 – 10
- 330
So, it looks like the function has a minimum at the left endpoint x = 0. In fact, the y-value of f(0) = -10 is less than the y-value of f(4) = 6 at the local minimum, so f(0) = -10 is the absolute minimum on the interval [0, 10].
![graph of x cubed minus 9 x squared +24x - 10 on the interval [0, 10]](https://jdmeducational.com/wp-content/uploads/2022/10/graph-of-x-cubed-minus-9-x-squared-24x-10-on-the-interval-0-10.jpg)
How To Find Function Minimums (Graphing f(x))
There is a third way to find function minimums without using derivatives. This method involves graphing the function to find the lowest y-values.
Let’s look at a couple of examples to see how it works.
Example 1: How To Find Function Minimums With Graph Of f(x)
Let’s say we want to find the minimums of the function
- f(x) = 2x2 – 8x + 6
First, we will graph the function, which you can see below:
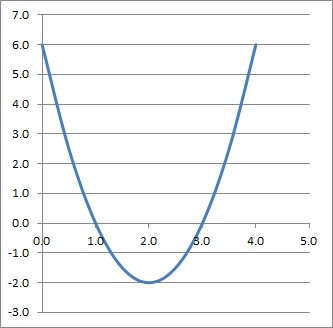
Note that we get a parabola, which is what we see when we draw the graph of a quadratic.
For a quadratic of the form y = ax2 + bx + c with a > 0, the only local minimum on the real numbers is at the vertex (bottom) of the parabola. This occurs at the value x = -b/2a.
Here, we have a = 2, b = -8, and c = 6. Since a = 2 > 0, the local minimum is at x = -b/2a = -(-8)/2(2) = 2.
At x = 2, the function has a value of f(2) = 2(2)2 – 8(2) + 6 = -2.
Example 2: How To Find Function Minimums With Graph Of f(x) On An Interval
Let’s say we want to find the minimums of the function
- f(x) = 2x2 – 8x + 6
on the interval [4, 6].
First, we will graph the function on the interval [4, 6], which you can see below:
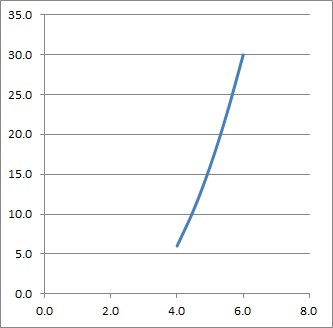
As in the previous example, we get a parabola, but now we only have a small portion of it (from x = 4 to x = 6).
We can see from the graph that the lowest y-value that occurs is at x = 4, when f(4) = 2(4)2 – 8(4) + 6 = 32 – 32 + 6 = 6.
So the minimum of f(x) on the interval [4, 6] is at the point (4, 6), the left endpoint of the interval.
Conclusion
Now you know a few ways to find function minimums (local and global).
You can learn about how to find function maximums here.
I hope you found this article helpful. If so, please share it with someone who can use the information.

Don’t forget to subscribe to our YouTube channel & get updates on new math videos!