
Exponential functions are found often in mathematics and in nature. However, this still raises the question of what these functions are and what they look like.
An exponential function is one with the form f(x) = abx, where a is the coefficient, b is the base, and x is the exponent. Any exponential function has a domain of all real numbers, but the domain may vary depending on the sign of a.
Of course, you can use information about the function (such as the asymptote and a few points on the curve) to draw the graph of an exponential function.
In this article, we’ll talk about exponential functions and what they are. We’ll also talk about their domain, range, and asymptotes, along with how to graph them.
Let’s begin.
What Is An Exponential Function?
An exponential function has the form
- f(x) = abx
where a is the coefficient, b is the base, and x is the exponent (note that a and b are both real numbers, where a is nonzero and b is positive).
For example, the function f(x) = 2(3x) is an exponential function with a coefficient of a = 2 and a base of b = 3.
We can always simplify an exponential function back to its simplest form f(x) = abx. For example, if we have the function f(x) = 5(2x+3), we can rewrite it as:
- f(x) = 5(2x + 3) [original function]
- f(x) = 5(2x*23) [by rules of exponents, AB + C = ABAc]
- f(x) = 5(2x*8) [since 23 = 8]
- f(x) = 40(2x) [since 5*8 = 40]
So this is really an exponential function with a = 40 and b = 2.
Note that we can also have a negative value for a. For example, the function f(x) = -4(5x) has a = -4 and b = 5. The graph will look a little difference, since it will be below the x-axis (due to the fact that a < 0).
What Is The Domain Of Exponential Functions?
The domain of an exponential function is all real numbers. The reason is that any real number is a valid input as an exponent.
This is because bx is always defined for b > 0 and x a real number. In fact, when x = 0, we get bx = b0 = 1, and f(0) will always be a.
An exponential function f(x) = abx is continuous, since it has no holes (removable discontinuities) or vertical asymptotes (zero denominators).
What Is The Range Of Exponential Functions?
The range of an exponential function depends on the values of a and b:
- For b = 1, the range of f(x) = abx is simply {a}.
- For b other than 1 and a > 0, the range of f(x) = abx is (0, infinity).
- For b other than 1 and a < 0, the range of f(x) = abx is (-infinity, 0).
Let’s prove this for various cases.
Case 1: b = 1
This case is easy. If b = 1, then:
- f(x) = abx
- f(x) = a(1x) [since b = 1]
- f(x) = a [since 1x = 1 for all real x]
Since f(x) = a for all real x, then the range of f(x) is the value {a}.
Case 2: 0 < b < 1
First, we find out the maximum and minimum values for bx. Since 0 < b < 1, bx will get smaller as x takes on larger positive values (for example, 0.52 = 0.25, 0.53 = 0.125, etc.).
The value of bx will always be positive, since b is positive, but there is no limit to how close to zero bx can get. Thus, the lower bound is 0.
Likewise, bx will get larger as x takes on larger negative values (for example, 0.5-2 = 4, 0.5-3 = 8, etc.)
The value of bx always be positive, since b is positive, and there is no limit to how large bx can get. Thus, the upper bound is infinity.
So, we know that 0 < bx < infinity.
If a > 0, then a*0 < a*bx < infinity, or 0 < f(x) < infinity.
If a < 0, then –infinity < a*bx < 0, or –infinity < f(x) < 0.
So, the range of f(x) = abx is (0, infinity) for a > 0 and (-infinity, 0) for a < 0.
Case 3: b > 1
First, we find out the maximum and minimum values for bx. Since b > 1, bx will get larger as x takes on larger positive values (for example, 22 = 4, 23 = 8, etc.).
The value of bx will always be positive, since b is positive, and there is no limit to how large bx can get. Thus, the upper bound is infinity.
Likewise, bx will get smaller as x takes on larger negative values (for example, 2-2 = 0.25, 2 -3 = 0.125, etc.)
The value of bx always be positive, since b is positive, but there is no limit to how close to zero bx can get. Thus, the lower bound is zero.
So, we know that 0 < bx < infinity.
If a > 0, then a*0 < a*bx < infinity, or 0 < f(x) < infinity.
If a < 0, then –infinity < a*bx < 0, or –infinity < f(x) < 0.
So, the range of f(x) = abx is (0, infinity) for a > 0 and (-infinity, 0) for a < 0.
How To Get The Asymptote Of An Exponential Function
The asymptote of an exponential function will always be the horizontal line y = 0. There is no vertical asymptote for an exponential function.
We can shift the horizontal asymptote up or down if we add or subtract from the exponential function.
For example:
- The exponential function f(x) = 3(2x) has a horizontal asymptote at y = 0.
- The exponential function g(x) = 3(2x) + 4 has a horizontal asymptote at y = 4.
- The exponential function h(x) = 3(2x) – 5 has a horizontal asymptote at y = -5.
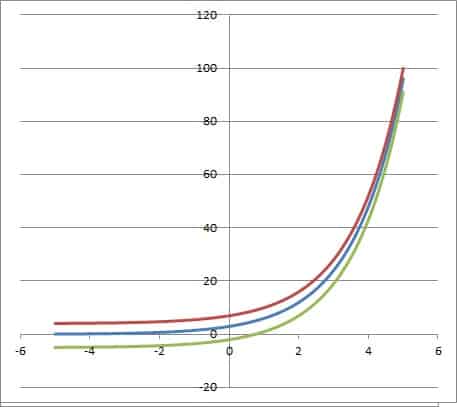
The graph of g(x) = 3(2x) + 4 is in red(the upper curve).
The graph of h(x) = 3(2x) – 5 is in green (the lower curve).
How To Graph An Exponential Function
To graph an exponential function, the best way is to use these pieces of information:
- Horizontal asymptote (y = 0, unless the function has been shifted up or down).
- The y-intercept (the point where x = 0 – we can find the y coordinate easily by calculating f(0) = ab0 = a*1 = a).
- The point where x = 1 (this is easy to calculate – we can find the y coordinate by calculating f(1) = ab1 = ab).
So, for the exponential function f(x) = abx, we will have a horizontal asymptote of y = 0, and points (0, a) and (1, ab).
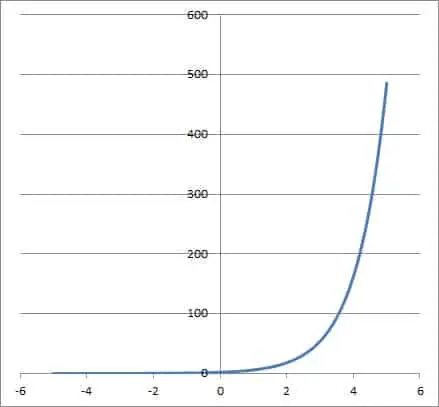
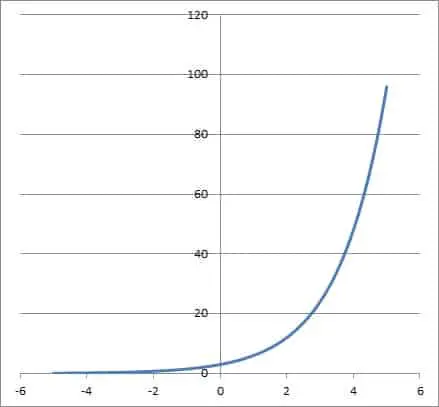
Example 1: Graphing An Exponential Function With a > 0
Let’s graph the function f(x) = 3(2x), which has a = 3 and b = 2.
We know the horizontal asymptote is at y = 0.
We also know that one point on the graph is (0, a) = (0, 3).
Another point on the graph is (1, ab) = (1, 3*2) = (1, 6).
With these three pieces of information (and knowing the approximate shape of an exponential graph), we can sketch the curve.
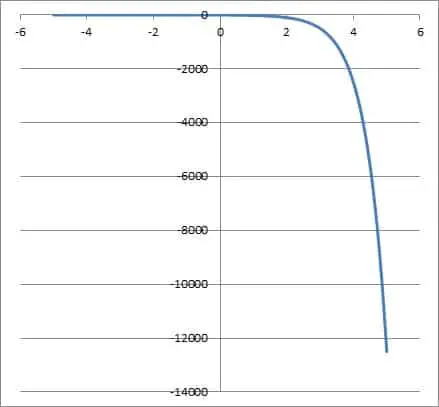
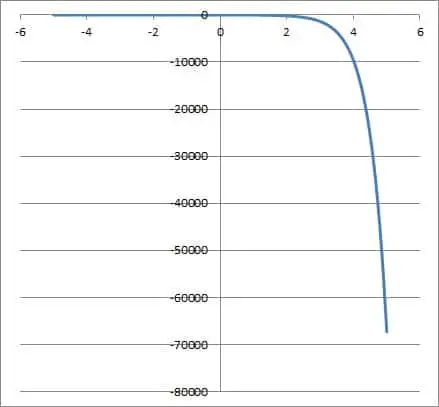
Example 2: Graphing An Exponential Function With a < 0
Let’s graph the function f(x) = -4(7x), which has a = -4 and b = 7.
We know the horizontal asymptote is at y = 0.
We also know that one point on the graph is (0, a) = (0, -4).
Another point on the graph is (1, ab) = (1, -4*7) = (1, -28).
With these three pieces of information (and knowing the approximate shape of an exponential graph), we can sketch the curve.
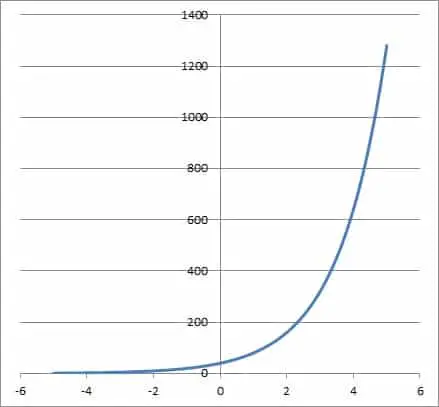
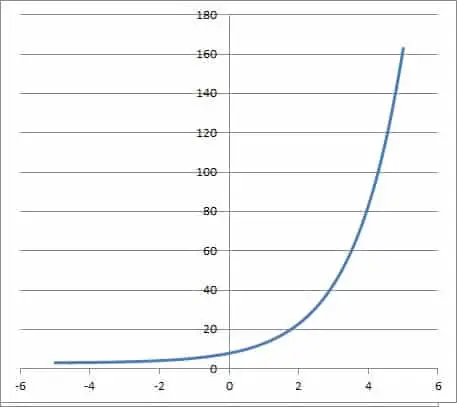
Example 3: Graphing An Exponential Function With A Vertical Shift
Let’s graph the function f(x) = 5(2x) + 3, which has a = 5 and b = 2, with a vertical shift of 3 units up.
We know the horizontal asymptote is at y = 3.
We can find one point on the graph when x = 0:
- f(x) = 5(2x) + 3 [original function]
- f(0) = 5(20) + 3 [let x = 0]
- f(0) = 5(1) + 3 [since 20 = 1]
- f(0) = 8
So, the point (0, 8) is on the graph.
We can find another point on the graph when x = 1:
- f(x) = 5(2x) + 3 [original function]
- f(0) = 5(21) + 3 [let x = 1]
- f(0) = 5(2) + 3 [21 = 2]
- f(0) = 13
So, the point (1, 13) is on the graph as well.
With these three pieces of information (and knowing the approximate shape of an exponential graph), we can sketch the curve.
Conclusion
Now you know a little more about exponential functions, along with their domain, range, and asymptotes. You also know how to graph these functions using some basic information that you can get from the exponential function and its parameters.
You can learn how to find the formula of an exponential function here.
You can learn more about the natural base e ~ 2.718 here.
You can learn about when a function is onto (maps onto the entire codomain) in my article here.
You can learn more about exponential functions in this resource from Lamar University.
You can learn about other nonlinear functions in my article here.
You can learn about the differences between domain & range here.
You can learn about exponential growth here.
I hope you found this article helpful. If so, please share it with someone who can use the information.
Don’t forget to subscribe to my YouTube channel & get updates on new math videos!
~Jonathon