
When we work with polynomials, we may want to find the domain and range. This helps us to graph the function, including any local or absolute extrema (maximums or minimums).
So, what is the domain and range of a polynomial function? The domain of a polynomial function is the set of all real numbers (since there can be no zero denominator). The range of a polynomial function is the set of possible output values, which is often found by analyzing the graph, looking at exponents, or finding the domain of the inverse function.
Of course, we can also use calculus to find local and absolute extrema (maximums and minimums) of polynomials. This can also help us to figure out the range of a polynomial.
In this article, we’ll talk about how to find the domain and range of a polynomial function, both with algebra and by looking at graphs.
Let’s get started.
Having math trouble?
Looking for a tutor?

Domain & Range Of A Polynomial Function
First, it is important to define the key terms.
Remember that a polynomial is a sum of terms of the form anxn, where an is a coefficient and xn is a variable raised to the nth power. For example, the following are polynomials:
- 5
- 2x + 5
- x2 + 5
- x2 + 3x + 5
- x3 – 4x2 + 2x – 7
- …etc.
Now that we know what a polynomial is, we can find its domain and range.
In simple terms:
- The domain of a polynomial function is the set of all possible inputs (x-values). This is because there can be no zero denominator or negative radicand with an even index in a polynomial.
- The range of a polynomial function is the set of all possible outputs (y-values). For example, the range of f(x) = x2 is all nonnegative real numbers, often denoted at R+u{0}.
There are a few ways that we can figure out the range of a polynomial function:
- Graphing – this method gives us a helpful visual of the polynomial function. The drawback is that we need to graph the proper range to see any absolute maximums or minimums.
- Exponents – this method gives us a shortcut for certain polynomial functions. For example, x2, x4, x6, etc. all have a range of nonnegative real numbers. Similarly, x2 + 1, x4 + 1, x6 + 1, etc. all have a range of [1, ∞).
- Derivatives – taking the derivative of a polynomial function f(x) gives us another polynomial function f’(x). If we set f’(x) equal to zero and solve for x, we find the x-coordinates of potential maximums and minimums. We can verify with the second derivative f’’(x) or use a graph to help us verify these extreme points.
Since we know that the domain of a polynomial function is always R (the set of all real numbers), we will now look at how to find the range.
How To Find The Range of A Polynomial Function
As mentioned above, there are a few different methods to find the range of a polynomial function. We will start with graphing, move on to exponents, and then take a look at derivatives.
Find The Range Of A Polynomial Function By Graphing
To find the range of a polynomial function by graphing, you can use a graphing calculator, a computer algebra system, or an app (in other words, a machine to help you with graphing.
However, you will still need to be able to figure out the proper “window” (set of x and y values) to use on your coordinate axes to capture the entire function.
Let’s look at a few examples.
Example 1: Find The Range Of A Polynomial Function By Graphing
Let’s say we have the polynomial function f(x) = x2 – 10x + 16. The graph of this function is shown below:
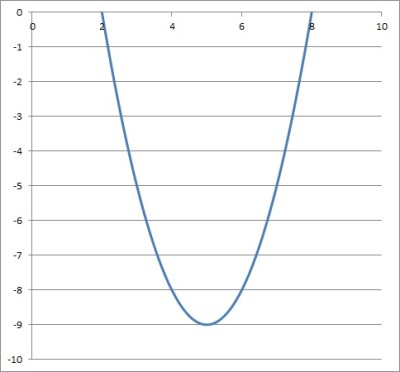
It appears that the range of the function is [-9, ∞). We can verify this with some algebra.
Note that his polynomial is a quadratic of the form ax2 + bx + c, with a = 1, b = -10, and c = 16. It is not difficult to factor and solve for the zeros of the function:
- f(x) = 0
- x2 – 10x + 16 = 0
- (x – 2)(x – 8) = 0
This means that the function has zeros at x = 2 and x = 8. By symmetry of a parabola (the graph of a quadratic, pictured above), we know that the vertex must be at x = 5.
After we substitute x = 5 into our function, we get a y-value of f(5) = 52 – 10(5) + 16 = -9.
So, the vertex is at x = 5, y = -9. Since a > 0 (a = 1), the polynomial has a minimum at the vertex (5, -9).
So, the range of the function is [-9, ∞), which reinforces what we found from the graph above.
Example 2: Find The Range Of A Polynomial Function By Graphing
Let’s say we have the polynomial function f(x) = x3 + 6x2 + 8x . The graph of this function is shown below:
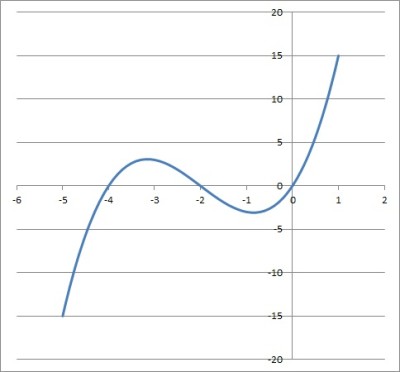
It appears that the range of the function is (-∞, ∞). We can verify this with some analysis.
With larger positive values of x, the x3 term will continue to grow without bound, outpacing the 6x2 and 8x terms. As x approaches infinity, x3 approaches infinity, and so f(x) grows without bound (there is no upper limit for the polynomial function).
Similarly, with larger negative values of x, the x3 term will continue to grow more negative without bound, outpacing the 6x2 and 8x terms. As x approaches negative infinity, x3 approaches negative infinity, and so f(x) grows more negative without bound (there is no lower limit for the polynomial function).
Example 3: Find The Range Of A Polynomial Function By Graphing
Let’s say we have the polynomial function f(x) = -x4 + 8x2 – 15. The graph of this function is shown below:
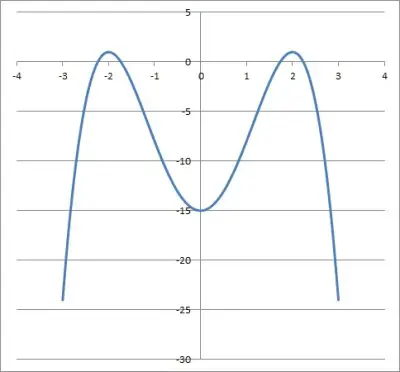
It appears that the range of the function is (-∞, 1]. We can verify this with some algebra.
Note that we can make the change of variables t = x2:
- f(x) = -x4 + 8x2 – 15 [original function]
- f(x) = -t2 + 8t – 15 [replace x2 with t]
Now we have a quadratic equation in the variable t, which we know how to solve. We will complete the square to find the maximum value of f(x):
- f(t) = -t2 + 8t – 15
- =-(t2 – 8t + 15) [factor out a -1]
- =-(t2 – 8t + 15 + 1 – 1) [add 1 to complete the square, subtract 1 to balance]
- =-(t2 – 8t + 16 – 1)
- =-((t – 4)2 – 1) [factor the square]
- =-(t – 4)2 + 1 [distribute the -1]
Since (t – 4)2 is at least zero for real values of t, then we know that –(t – 4)2 is at most zero (when t = 4). So, the maximum value of –(t – 4)2 + 1 is 1, at t = 4.
Switching back to the x-variable, we get:
- t = 4
- x2 = 4
- x = -2, x = 2
So, the maximum value of the function is y = 1 at x = -2 and x = 2. This supports what the graph above suggests.
Having math trouble?
Looking for a tutor?
Find The Range Of A Polynomial Function By Exponents
To find the range of a polynomial function by exponents, you will need to analyze the parity (even or odd) of the largest exponent (highest order term) to help you decide on what values the function can take on.
- If the highest exponent is odd, then the range is the entire set of real numbers, (-∞, ∞).
- If the highest exponent is even, then look at the sign of the coefficient of the highest order term. If it is positive, then the range is bounded below. If it is negative, then the range is bounded above.
Let’s look at a few examples.
Example 1: Find The Range Of A Polynomial Function By Exponents
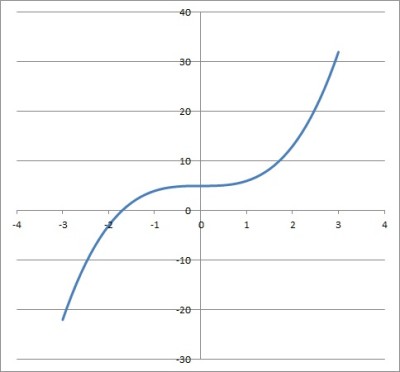
Let’s say we have the polynomial function f(x) = x3 + 5.
The highest exponent in this polynomial is 3 (from the x3 term). Since 3 is odd, then the range of this polynomial function is (-∞, ∞).
The graph of this function is shown below:
Example 2: Find The Range Of A Polynomial Function By Exponents
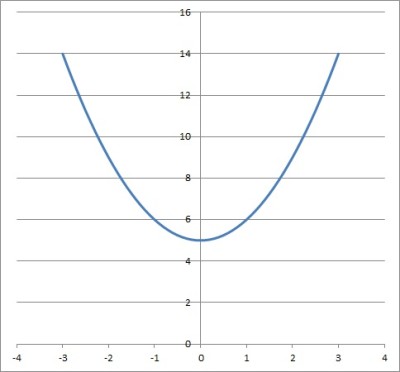
Let’s say we have the polynomial function f(x) = x2 + 5.
The highest exponent in this polynomial is 2 (from the x2 term). Since 2 is even, we need to look at the leading coefficient (the coefficient of the highest order term).
The leading coefficient is 1 (since x2 = 1x2). Since 1 is positive, the range of this polynomial function is bounded below.
We can tell that x2 >= 0, since a real number squared is always positive or zero. Then x2 + 5 >= 5, and so the range of this function is [5, ∞).
The graph of this function is shown below:
Example 3: Find The Range Of A Polynomial Function By Exponents
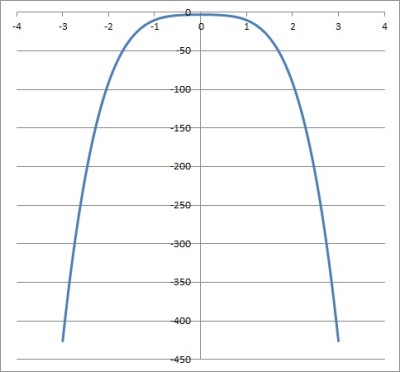
Let’s say we have the polynomial function f(x) = -5x4 – 2x2 – 3.
The highest exponent in this polynomial is 4 (from the -5x4 term). Since 4 is even, we need to look at the leading coefficient (the coefficient of the highest order term).
The leading coefficient is -5. Since -5 is negative, the range of this polynomial function is bounded above.
We can use the following inequalities to find an upper bound for the value of f(x):
- f(x) = -5x4 – 2x2 – 3
- <= -2x2 – 3 [since -5x4 <= 0]
- <= – 3 [since -2x2 <= 0]
So the range of this function is (-∞, -3].
The graph of this function is shown below:
Find The Range Of A Polynomial Function By Derivatives
To find the range of a polynomial function f(x) by derivatives, we take two derivatives:
- First, find f’(x) by differentiating f(x).
- Next, find f’’(x) by differentiating f’(x).
- Then, solve f’(x) = 0 to find the critical points (potential maximums or minimums).
- Now, use f’’(x) to verify a maximum or minimum.
- Finally, check whether you have local or global maximums or minimums.
Let’s look at a few examples.
Example 1: Find The Range Of A Polynomial Function By Derivatives
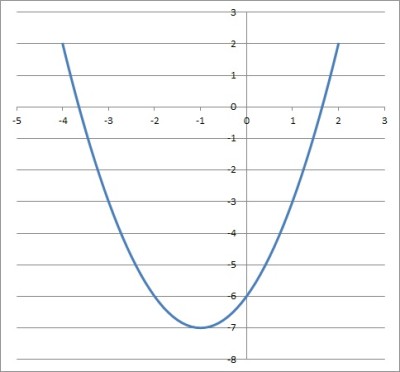
Let’s say we have the polynomial function f(x) = x2 + 2x – 6.
The first derivative is f’(x) = 2x + 2.
The second derivative is f’’(x) = 2.
Solving f’(x) = 0 gives us 2x + 2 = 0, or x = -1.
f’’(-1) = 2 > 0, so the function has a minimum at x = -1.
Looking at the graph below confirms that f(x) has a global minimum at x = -1. The vertex is (-1, -7).
So, the range is [-7, ∞).
Example 2: Find The Range Of A Polynomial Function By Derivatives
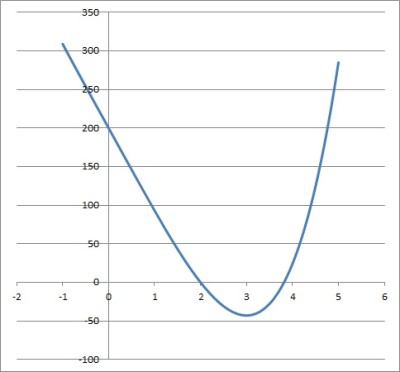
Let’s say we have the polynomial function f(x) = x4 -108x + 200.
The first derivative is f’(x) = 4x3 – 108.
The second derivative is f’’(x) = 12x2.
Solving f’(x) = 0 gives us 4x3 – 108 = 0 or x = 3 (the other two solutions are complex).
f’’(3) = 12(32) = 108 > 0, so the function has a minimum at x = 3.
Looking at the graph below confirms that f(x) has a global minimum at x = 3. The vertex is (3, -43).
So, the range is [-43, ∞).
Conclusion
Now you know how to find both the domain and range of a polynomial function. You also know how to look at the graphs to help you decide if your solution makes sense.
You can learn how to find a polynomial from a graph here.
I hope you found this article helpful. If so, please share it with someone who can use the information.
Don’t forget to subscribe to our YouTube channel & get updates on new math videos!