
Polynomials. Algebra students spend countless hours on polynomials. Well, maybe not countless hours. Your polynomial training likely started in middle school when you learned about linear functions. This happened around the time that math turned from lots of numbers to lots of letters!
In this article, we’ll go over how to write the equation of a polynomial function given its graph. There are lots of things to consider in this process. Let’s get started!
What Is A Polynomial? (Review Of Polynomials)
First, we need to review some things about polynomials. What is a polynomial? If we know anything about language, the word “poly” means “many,” and the word “nomial” means “terms.”
So a polynomial is an expression with many terms. A monomial is one term, but for our purposes we’ll consider it to be a polynomial.
| Definition of Polynomial The sum or difference of one or more monomials. A monomial is a variable, a constant, or a product of them. |
All of the following expressions are polynomials:
- 5x4 – 2x3 + x – 10
- 10x3 + 7x2 – 5x + 8
- -2x2
- (1/2)x -1
- 5
The following expressions are NOT polynomials:
| Non- Polynomial | Reason |
|---|---|
| 4x1/2 | Fractional exponents are not allowed. In this case, the ½ power turns the expression into 4x which is no longer a polynomial. |
| 5x-2 – 7x + 4 | Negative exponents are not allowed. The term 5x-2 is the same as 5/x2. |
| 1x – 3x – 6 | Variables in the denominator are not allowed. |
| (2x2 + 3x -1)/(x – 1) | Variables in the denominator are not allowed. |
One nice feature of the graphs of polynomials is that they are smooth. Think about the graph of a parabola or the graph of a cubic function.
There are no sharp turns or corners in the graph. Now, let’s look at one type of problem we’ll be solving in this lesson.
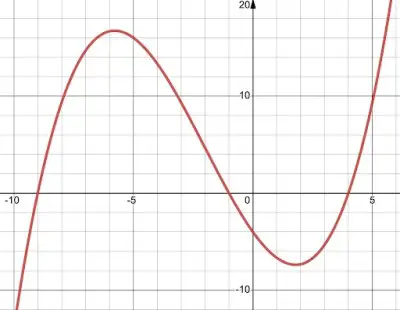
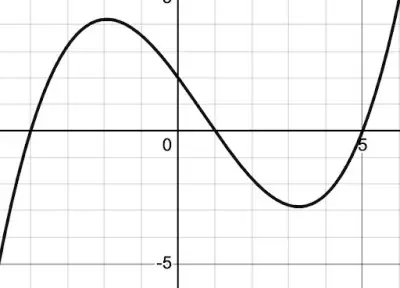
Example 1 – Graph Of A Polynomial With Degree 3
The graph of a degree 3 polynomial is shown. Write the equation of the function.
Before we solve the above problem, let’s review the definition of the degree of a polynomial.
| The degree of a polynomial is the highest exponential power of the variable. |
For example, the polynomial f(x) = 5x7 + 2x3 – 10 is a 7th degree polynomial.
Now, let’s write a function for the given graph. We’ll make great use of an important theorem in algebra: The Factor Theorem.
| The Factor Theorem For a polynomial f, if f(c) = 0 then x-c is a factor of f. Conversely, if x-c is a factor of f, then f(c) = 0. |
The Factor Theorem helps us tremendously when working with polynomials – if we know a zero of the function, we can find a factor.
Getting back to our example problem – there are several key points on the graph: the three zeros and the y-intercept. Let’s label those points:
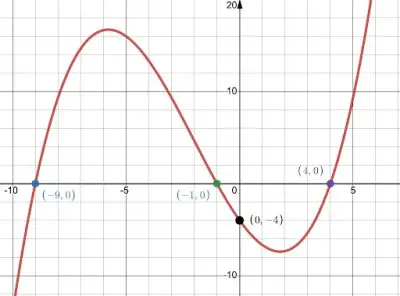
Notice, there are three times that the graph goes straight through the x-axis. Imagine zooming into each x-intercept.
Even though the function isn’t linear, if you zoom into one of the intercepts, the graph will look linear. For example, if you zoom into the zero (-1, 0), the polynomial graph will look like this:
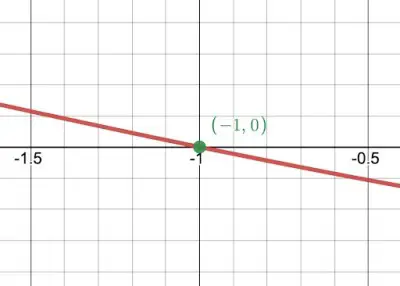
Keep in mind: this is the graph of a curve, yet it looks like a straight line! From the Factor Theorem, we know if -1 is a zero, then (x + 1) is a factor.
Similarly, since -9 and 4 are also zeros, (x + 9) and (x – 4) are also factors. Hence, we can write our polynomial as such:
- f(x) = a(x + 1)(x + 9)(x – 4)
Now, we can calculate the value of the constant a. We can do this by using another point on the graph.
Typically, an easy point to find from a graph is the y-intercept, which we already discovered was the point (0. -4). If the y-intercept isn’t on the intersection of the gridlines of the graph, it may not be easy to definitely determine it from the graph.
In that case, sometimes a relative maximum or minimum may be easy to read off of the graph. Or, find a point on the graph that hits the intersection of two grid lines.
To calculate a, plug in the values of (0, -4) for (x, y) in the equation:
- -4 = a(0 + 1)(0 + 9)(0 – 4)
- -4 = a(1)(9)(-4)
- -4 = -36a
- a = 1/9
So, the polynomial function is:
- f(x) = (1/9)(x + 1)(x + 9)(x – 4)
If we want to put that in standard form, we’d have to multiply it out. Let’s not bother this time! 🙂
How can we find the degree of a polynomial from its graph?
Let’s discuss the degree of a polynomial a bit more. Suppose we’re given the graph of a polynomial but we aren’t told what the degree is. How can we find the degree of the polynomial? The Fundamental Theorem of Algebra can help us with that.
| The Fundamental Theorem of Algebra Given a polynomial of degree n, the polynomial has exactly n roots, including complex and multiple roots. |
For example, a linear equation (degree 1) has one root. A quadratic equation (degree 2) has exactly two roots. A cubic equation (degree 3) has three roots. And so on. When counting the number of roots, we include complex roots as well as multiple roots. For our purposes in this article, we’ll only consider real roots. This means:
| Given a polynomial of degree n, the polynomial has less than or equal to n real roots, including multiple roots. |
Reminder: The real zeros of a polynomial correspond to the x-intercepts of the graph. Roots of a polynomial are the solutions to the equation f(x) = 0.
If p(x) = 2(x – 3)2(x + 5)3(x – 1). The zeros are 3, -5, and 1.
We say that the zero 3 has multiplicity 2, -5 has multiplicity 3, and 1 has multiplicity 1. If a polynomial is in factored form, the multiplicity corresponds to the power of each factor.
The graph goes straight through the x-axis.
How does this help us in our quest to find the degree of a polynomial from its graph? Let’s first look at a few polynomials of varying degree to establish a pattern.
Degree 1
y = 2x + 3
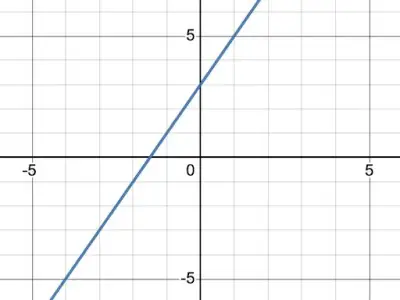
1 real zero.
Degree 2
y = x2
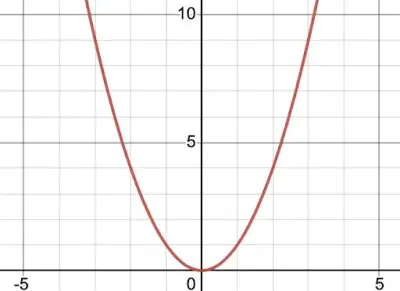
1 real zero with multiplicity of 2.
The graph bounces off the x-axis.
Degree 2
y = (x – 3)2 + 1
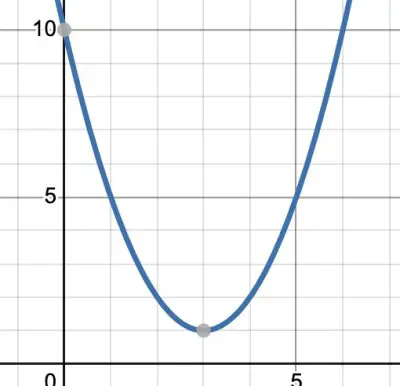
No real zeros.
The graph doesn’t touch or cross the x-axis.
This is a situation for another day!
Degree 2
y= ½ (x – 5)(x + 2)
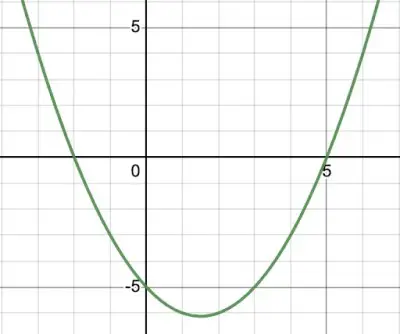
2 real zeros.
At each x-intercept, the graph goes straight through the x-axis. The graph looks approximately linear at each zero. Each zero has a multiplicity of one. Each zero is a single zero.
Degree 3
y = x3
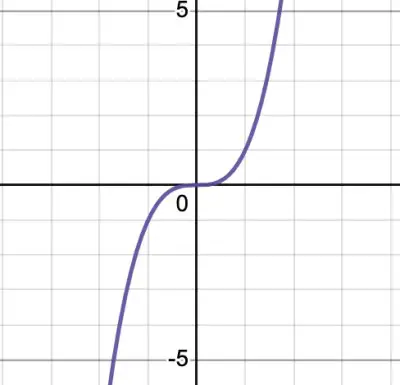
1 real zero.
The graph skims the x-axis and crosses over to the other side.
The zero that occurs at x = 0 has multiplicity 3.
Degree 3
y = 0.10(x -1)(x + 4)(x – 5)
3 real zeros.
At each x-intercept, the graph crosses straight through the x-axis. The graph looks approximately linear at each zero. Each zero has a multiplicity of 1.
Okay, so we’ve looked at polynomials of degree 1, 2, and 3. It seems as though we have situations where the graph goes straight through the x-axis, the graph bounces off the x-axis, or the graph skims the x-intercept as it passes through it.
A closer examination of polynomials of degree higher than 3 will allow us to summarize our findings. Consider:
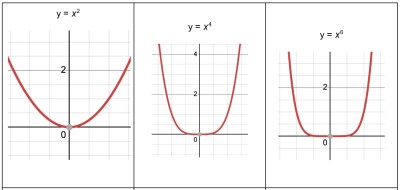
Notice, for the even degree polynomials y = x2, y = x4, and y = x6, as the power of the variable increases, then the parabola flattens out near the zero.
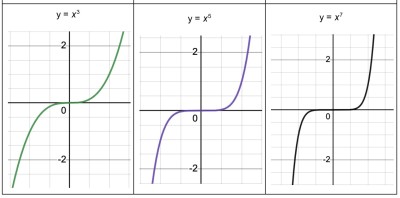
For the odd degree polynomials, y = x3, y = x5, and y = x7, the graph skims the x-axis in each case as it crosses over the x-axis and also flattens out as the power of the variable increases.
We now summarize our results:
| Summary of Muliplicities -If the graph crosses the x-axis at and looks linear, then we have a single zero, that is, a zero of multiplicity 1. -If the graph bounces off the x-axis, we have a zero of even multiplicity. -If the graph skims the x-axis and crosses through it, we have a zero of odd multiplicity. -The degree of a polynomial is the sum of the multiplicities of each of its factors. |
These results will help us with the task of determining the degree of a polynomial from its graph. Sometimes we may not be able to tell the exact power of the factor, just that it is odd or even.
(You can learn more about even functions here, and more about odd functions here).
Often, if this is the case, the problem will be written as “write the polynomial of least degree that could represent the function.” So, if we know a factor isn’t linear but has odd degree, we would choose the power of 3. Let’s look at another problem.
Example 2 – Finding A Polynomial From A Graph
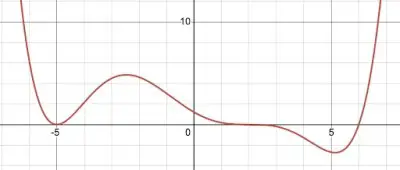
Given the graph below with y-intercept 1.2, write a polynomial of least degree that could represent the graph.
Solution
First, we’ll identify the zeros and their multiplities using the information we’ve garnered so far.
Starting from the left side of the graph, we see that -5 is a zero so (x + 5) is a factor of the polynomial. Since the graph bounces off the x-axis, -5 has a multiplicity of 2.
2 is a zero so (x – 2) is a factor. The graph skims the x-axis. 2 has a multiplicity of 3.
6 is a zero so (x – 6) is a factor. The graph passes straight through the x-axis. 6 has a multiplicity of 1. It is a single zero.
By adding the multiplicities 2 + 3 + 1 = 6, we can determine that we have a 6th degree polynomial in the form:
- f(x) = a(x + 5)2(x – 2)3(x – 6)
Use the y-intercept (0, 1,2) to solve for the constant a. Plug in x = 0 and y = 1.2.
- 1.2 = a(0 + 5)2(0 – 2)3(0 – 6)
- 1.2 = a(25)(-8)(-6)
- 1.2 = 1200a
- a = 0.001 or 1/1000
Hence, our polynomial equation is f(x) = 0.001(x + 5)2(x – 2)3(x – 6).
Now, let’s change things up a bit. Suppose we’re given the function and we want to draw the graph. How do we do that? Let’s look at an example.
Sketch a polynomial graph from a function
Example 3 – Sketch A Polynomial Graph From A Function
Sketch the polynomial p(x) = (1/4)(x – 2)2(x + 3)(x – 5)
Solution
First, let’s find the x-intercepts of the polynomial. Set the equation equal to zero and solve:
- (1/4)(x – 2)2(x + 3)(x – 5) = 0
This is easy enough to solve by setting each factor to 0. We can see that we have 3 distinct zeros: 2 (multiplicity 2), -3, and 5. Hence, we already have 3 points that we can plot on our graph.
Another easy point to find is the y-intercept. Let x = 0 and solve:
- y = ¼ (0 – 2)2(0 + 3)(0 – 5)
- y = ¼ (4)(3)(-5)
- y = -15
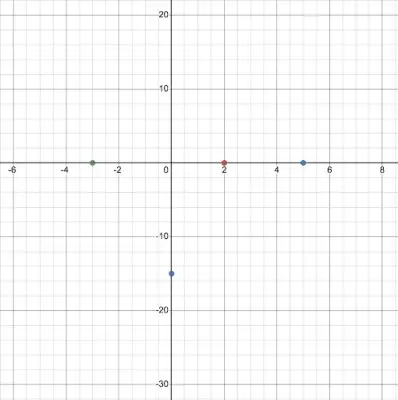
Now, let’s plot our four points:
Let’s think a bit more about how we are going to graph this function.
Since 2 has a multiplicity of 2, we know the graph will bounce off the x axis for points that are close to 2.
Since -3 and 5 each have a multiplicity of 1, the graph will go straight through the x-axis at these points.
Where do we go from here? How do we know if the graph will pass through -3 from above the x-axis or from below the x-axis?
A quick review of end behavior will help us with that. The end behavior of a function describes what the graph is doing as x approaches ∞ or -∞.
Review of end behavior for polynomials
| Degree | Lead Coeff- icient | End Beha- vior | Example |
| even | positive | starts high, ends high | y = x2 |
| even | negative | starts low, ends low | y = –x2 |
| odd | positive | starts low, ends high | y = x3 |
| odd | negative | starts high, ends low | y = –x3 |
Imagine multiplying out our polynomial – the leading coefficient is 1/4 which is positive and the degree of the polynomial is 4. So, the function will start high and end high.
We could now sketch the graph but to get better accuracy, we can simply plug in a few values for x and calculate the values of y.
| x | y |
|---|---|
| -2 | -28 |
| 3 | -3 |
| 4 | -7 |
By plotting these points on the graph and sketching arrows to indicate the end behavior, we can get a pretty good idea of how the graph looks!
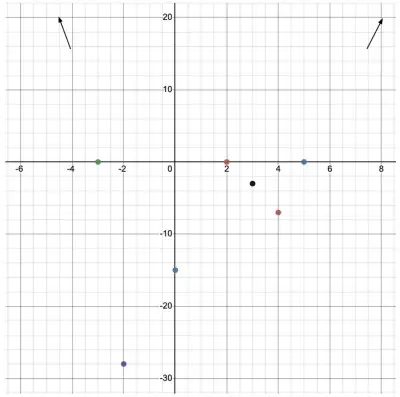
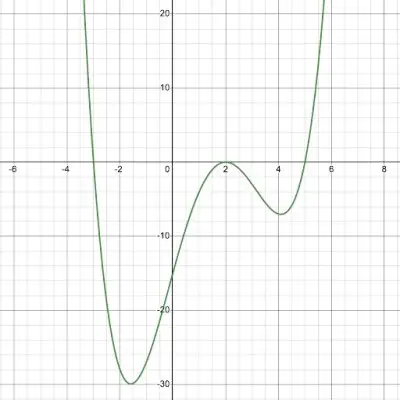
Now, we can sketch the graph!
How To Find A Polynomial Given Points
Let’s look at another type of problem. Suppose we’re given a set of points and we want to determine the polynomial function.
How many points will we need to write a unique polynomial? If we think about this a bit, the answer will be evident.
We know that two points uniquely determine a line. And, it should make sense that three points can determine a parabola. This leads us to an important idea.
| To determine a polynomial of nth degree from a set of points, we need n + 1 distinct points. |
Example 4 – Finding A Polynomial Of Degree 4 From 5 Points
A polynomial p(x) of degree 4 has single zeros at -7, -3, 4, and 8. It also passes through the point (9, 30). Find the polynomial.
Solution
First, notice that we have 5 points that are given so we can uniquely determine a 4th degree polynomial from these points. Using the Factor Theorem, we can write our polynomial as
- p(x) = a(x +7)(x +3)(x – 4)(x – 8)
Plug in the point (9, 30) to solve for the constant a.
- 30 = a(9 +7)(9 +3)(9 – 4)(9 – 8)
- 30 = a(16)(12)(5)(1)
- 30 = 960a
- a = 1/32
Therefore, our polynomial p(x) = (1/32)(x +7)(x +3)(x – 4)(x – 8).
Polynomials are a huge part of algebra and beyond. Hopefully, today’s lesson gave you more tools to use when working with polynomials!
I hope you found this article helpful. If so, please share it with someone who can use the information.

Don’t forget to subscribe to our YouTube channel & get updates on new math videos!
About the author:
Jean-Marie Gard is an independent math teacher and tutor based in Massachusetts. You can get in touch with Jean-Marie at https://testpreptoday.com/.