
Weighted average is a concept that is useful in probability and statistics, as well as in other applications (such as giving one numerical ranking as a weighted average of several different factors).
So, what do you need to know about weighted average? Weighted average is a type of average that can assign a different weight to each data value. We can make calculations easier if we choose weights that add up to 1. Average (arithmetic mean) is a special case of weighted average where each weight is the same (1/n, where n is the number of data points).
Of course, weighted average can be used in many contexts in math and beyond. For example, expected value relies on weighted average, with the weights being probabilities that add up to 1.
In this article, we’ll talk about weighted average, what it means, and how to calculate it, along with some examples of when it is used. We’ll also talk about how weighted average is different from average (arithmetic mean) and median.
Let’s get started.
What Is Weighted Average?
A weighted average is a type of average that can assign a different weight to each data value (compare this to average or arithmetic mean, which assigns the same weight to each data value).
For a data set {x1, x2, … , xn} with corresponding weights {w1, w2, … , wn}, the weighted average is:
- (w1x1 + w2x2 + … + wnxn) / (w1 + w2 + … + wn)
Note that the weights w1, w2, … , wn do not all need to be the same. They could all have different values, or some of them could be the same, or all of them could be the same (as in an average or arithmetic mean).
If you require that all of the weights add up to 1, we get a simplified formula for weighted average:
- (w1x1 + w2x2 + … + wnxn) / (w1 + w2 + … + wn)
- =(w1x1 + w2x2 + … + wnxn) / 1 [since the weights add up to 1]
- =w1x1 + w2x2 + … + wnxn
This is common in probability and statistics when calculating expected value, where all weights (probabilities) add up to 1.
Example: How To Calculate A Weighted Average
Let’s say that we want to calculate a weighted average with the following weights and data values:
- w1 = 3
- w2 = 5
- w3 = 2
- x1 = 4
- x2 = 7
- x3 = 1
Using the formula from before, we get:
- (w1x1 + w2x2 + w3x3) / (w1 + w2 + w3) [formula for weighted average]
- =(3*4+ 5*7 + 2*1) / (3 + 5 + 2)
- =(12+ 35 + 2) / (10)
- =49 / 10
- =4.9
So the weighted average is 4.9.
Is Weighted Average The Same As Average?
Weighted average is not the same as average. Remember that average (or arithmetic mean) is a special case of weighted average.
- A weighted average can have any values for the weights w1, w2, … , wn.
- An average (arithmetic mean) must have equal weights that add up to 1: w1 = w2 = … = wn = 1/n.
So, for an average, each weight is 1/n, and when we add up n of them, we get:
- 1/n + 1/n + … + 1/n
- =n(1/n)
- =1
We can see these weights if we rearrange the formula for the average of n data values x1, x2, … , xn:
- Average = (x1 + x2 + … + xn) / n [by definition of average or arithmetic mean]
- = (x1 / n) + (x2 / n) + … + (xn / n) [split the original fraction into n different fractions with the same denominator of n]
- =(1/n)x1 + (1/n)x2 + … + (1/n)xn [since xi / n = (1/n)xi]
- =w1x1 + w2x2 + … + wnxn [where each weight is wi = 1/n]
Is Weighted Average The Same As Median?
Weighted average is not the same as median. Median is found by arranging the data values in increasing order and then taking the “middle” term.
- A weighted average assigns a weight wi to each data value xi and adds up the products wixi.
- A median does not use weights, and does not add up the values of the data values.
If there are n terms and n is odd, we take the (n + 1)/2 as the median. If there are n terms and n is odd, we take the average of the n/2 and (n+2)/2 terms as the median.
Note that there is also a weighted median, which is not the same as median and not the same as weighted average. Also remember that median is the not the same as mean.
When, Why, & How To Use Weighted Average
So, why do we use weighted average? Well, we can use weighted average in several cases, such as:
- when we calculate expected value
- when we give a single numerical ranking based on multiple factors
Let’s look at some specific examples of how to use weighted average.
Example 1: Using Weighted Average To Calculate Expected Value
Let’s say that there are three possibilities for the value of a house in 1 year:
- Low: $400,000
- Medium: $500,000
- High: $600,000

We guess the following probabilities for each case:
- Low: 20%
- Medium: 50%
- High: 30%
Note that these probabilities add up to 1 (100%): 20% + 50% + 30% = 100%. This must be the case, since the total probability space always adds up to 1.
We can find a weighted average by treating the probabilities as the weights and the house prices as the data values.
Then we have:
- w1 = 0.2 (20%)
- w2 = 0.5 (50%)
- w3 = 0.3 (30%)
- x1 = 400,000
- x2 = 500,000
- x3 = 600,000
Since the weights wi add up to 1, we can use the shortcut formula for weighted average from earlier:
- w1x1 + w2x2 + w3x3 [use the shortcut formula for weighted average, since the weights add up to 1]
- =0.2*400,000 + 0.5*500,000 + 0.3*600,000
- =80,000 + 250,000 + 180,000
- =510,000
So, the expected value of the home in1 year is $510,000. This value is a weighted average of the 3 price predictions we made, with weights of the probabilities we guessed.
Note that expected value can be negative in some cases (at least some of the data values must be negative).
Example 2: Using Weighted Average To Distill Multiple Factors Into A Single Numerical Ranking
Let’s say we want to compare two different houses by coming up with a single number for each one.
The factors we will use (on a scale of 0 to 10) are:
- House Size (Square Footage)
- House Location
- House Age

We decide on the following weights:
- w1 = 10% for house size (if you don’t need a huge house)
- w2 = 60% for house location (if you are very concerned with the neighborhood or local amenities)
- w3 = 30% for house age (you don’t want to buy something very old)
Note that our weights add up to 1 (100%), so we can use the shortcut formula for weighted average.
Based on these factors, a low ranking (close to 0) would mean a small house, a poor location, or an old house. A high ranking (close to 10) would mean a large house, a good location, or a new house.
The highest ranking house would win our comparison. So, let’s compare these two:
- House 1 has a house size rating of 8, a house location rating of 6, and a house age rating of 7.
- House 2 has a house size rating of 2, a house location rating of 8, and a house age rating of 4.
Taking the weighted average for House 1, we get:
- w1x1 + w2x2 + w3x3 [use the shortcut formula for weighted average, since the weights add up to 1]
- =0.1*8 + 0.6*6 + 0.3*7
- =0.8 + 3.6 + 2.1
- =6.5
Taking the weighted average for House 2, we get:
- w1x1 + w2x2 + w3x3 [use the shortcut formula for weighted average, since the weights add up to 1]
- =0.1*2 + 0.6*8 + 0.3*4
- =0.2 + 4.8 + 1.2
- =6.2
So it looks like House 1 wins by a small amount (6.5 is a little bigger than 6.2). Note that if we change the weights, we might change which house wins the comparison.
Can You Do A Weighted Average Of Percentages?
You can take a weighted average of percentages. The easiest way to do this is to choose weights wi that add up to 1.
Example: A Weighted Average Of Percentages
Let’s say that you have a retirement account with two investments.
The first investment is $10,000 in company A, with a return of 12%.
The second investment is $30,000 in company B, with a return of 4%.

To take a weighted average of the percentage returns, we need two weights: one for company A and one for company B.
To find the weights, we divide the dollar amount for a company by the total amount invested in the retirement account:
- Total Amount Invested = (Investment In Company A) + (Investment In Company B)
- Total Amount Invested = ($10,000) + ($30,000)
- Total Amount Invested = $40,000
So the weight for company A is $10,000 / $40,000 = 1/4 or 0.25.
Similarly, the weight for company B is $30,000 / $40,000 = 3/4 or 0.75.
Using these weights, we can calculate the weighted average percentage return for the investments in the retirement account:
- (Weighted Average Percentage Return) = w1x1 + w2x2
- (Weighted Average Percentage Return) = 0.25(12%) + 0.75(4%)
- (Weighted Average Percentage Return) = 3% + 3%
- (Weighted Average Percentage Return) = 6%
Note that this weighted average is not the same as the average (arithmetic mean) of the two percentage returns:
- (Arithmetic Mean) = (12% + 4%) / 2
- (Arithmetic Mean) = 16% / 2
- (Arithmetic Mean) = 8%
The percentage return for the portfolio is closer to the percentage return for Company B because there is more weight (money) invested in Company B than in Company A.
Can Excel Calculate Weighted Average?
Excel can calculate a weighted average. There are two ways to do this:
- Create 3 columns: one for weights wi, one for data values xi, and one for the products wixi. Next, add up the first column to get the sum of the weights wi. Then, add up the third column to get the sum of the products wixi). Finally, divide the sum of the third column by the sum of the first column to get the weighted average.
- Use the sumproduct function, with the row (or column) of weights wi as the first input and the row (or column) of data values xi as the second input. Then, divide by the sum of the weights wi.
See below for Excel formulas for weighted average.
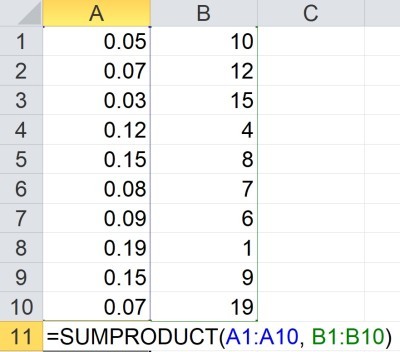
Is Sumproduct A Weighted Average?
Sumproduct will only be a weighted average if the sum of the weights is 1. Otherwise, you will need to take a sumproduct (with weights as one input and data values as another input) and then divide by the sum of the weights.
This comes from the formula for weighted average that we discussed earlier:
- (w1x1 + w2x2 + … + wnxn) / (w1 + w2 + … + wn)
or in Excel:
- =SUMPRODUCT(range of weights, range of data values) / SUM(range of weights)
For example, the range of weights might be A1:A10, while the range of data values might be B1:B10. This would give you:
- =SUMPRODUCT(A1:A10, B1:B10) / SUM(A1:A10)
Conclusion
Now you know more about weighted average and how to calculate it. You also know when it is used and how it differs from ordinary average (arithmetic mean) and median.
You might also want to learn more about the expected value of a dice roll (a specific type of weighted average).
I hope you found this article helpful. If so, please share it with someone who can use the information.
Don’t forget to subscribe to my YouTube channel & get updates on new math videos!
~Jonathon