
Direct variation comes up often in math and is also used in our everyday lives. However, there are still lots of questions that you can ask about direct variation.
So, what is direct variation? Direct variation is a linear relationship between two variables x and y, where the ratio y / x is always equal to a constant value k. The equation has the form y = kx, and it has only two variables, each with exponents of 1. The graph of the equation is a line that passes through the origin (0, 0).
Of course, the constant k in a direct variation can be negative or a fraction (or both). Both of these cases have a specific interpretation.
In this article, we will talk about direct variation, what it is, and why it is important. We’ll also look at some examples of equations, tables, and graphs that show (or do not show) direct variation.
Let’s get started.
What Is Direct Variation?
Direct variation is a relationship between two variables x and y where the ratio y / x is equal to a constant value k. We can write the equation:
- y / x = k
or, solving for y:
- y = kx
Note that this is the equation of a line with a y-intercept of zero (zero constant term). In this case, we say that “y is directly proportional to x” or “y varies directly with x”.
The value k is called the constant of variation. It tells us how much the value of y changes every time we change the value of x.
For example, if we have the direct variation y = 2x, then y increases by 2 whenever x increases by 1. Similarly, y decreases by 2 whenever x decreases by 1.
If we have the direct variation y = 10x, then y increase by 10 whenever x increases by 1. Similarly, y decreases by 10 whenever x decreases by 1.
You can see an example of a table for the direct variation y = 2x below.
| x | y |
|---|---|
| 0 | 0 |
| 1 | 2 |
| 2 | 4 |
| 3 | 6 |
| 4 | 8 |
direct variation
relationship y = 2x.
Why Is Direct Variation Important?
Direct variation is important because it can be used in several applications in our everyday lives. For example, we can use direct variation for:
- Distance Over Time (when traveling): if y is your distance traveled from a city, x is the time since you started your trip, and you travel at a constant speed k, then the direction variation y = kx tells you the distance from the city after x hours have passed.
- Pay Over Time (when working): if y is your total weekly pay, x is the hours you work in the week, and k is your hourly rate, then the direction variation y = kx tells you the amount you are paid in a week for working x hours at k dollars per hour.
- Force Over Length (of a spring): if y is the force on a spring, x is the displacement of the spring, and k is the spring constant, then the direction variation y = kx tells you the force needed to stretch (displace) a spring with constant k by a length of x.

So, there are plenty of uses of direct variation in our lives. However, this still leaves the question of how to tell that an equation, table, or graph is a direct variation.
How To Tell If An Equation Is A Direct Variation
To tell if an equation is a direct variation, look for the form y = kx. In particular, this means:
- There are only two variables (in our examples, we use x and y for our two variables).
- The only exponent of each variable in the equation is 1 (that is, we have a linear relationship).
- No variables are multiplied (we do not have an xy term).
- The constant term in the equation is 0 (the y-intercept of the line y = kx + 0 is the origin).
Example 1: An Equation That Is A Direct Variation
Consider the equation:
- y = 2x
This is a direct variation, since:
- There are only two variables: x and y.
- The exponent on each variable is equal to 1.
- No variables are multiplied (there is no xy term).
- The constant term in the equation is 0 (we can rewrite as y = 2x + 0).
Example 2: An Equation That Is Not A Direct Variation
Consider the equation:
- y = 2x + z
This is not a direct variation, since:
- There are three variables: x, y, and z.
Example 3: An Equation That Is Not A Direct Variation
Consider the equation:
- y = 2x3
This is not a direct variation, since:
- The variable x has an exponent of 3.
Example 4: An Equation That Is Not A Direct Variation
Consider the equation:
- xy = 2
This is not a direct variation, since:
- There is an xy term (the variables x and y are multiplied).
Note: this is an example of inverse variation, since y = 2 / x.
Example 5: An Equation That Is Not A Direct Variation
Consider the equation:
- y = x + 1
This is not a direct variation, since:
- There is a nonzero constant term (the y-intercept is 1).
How To Tell If A Table Is A Direct Variation
To tell if a table is a direct variation, look for a linear relationship between the columns in the table. In particular, this means:
- There are only two variables (in our examples, we use x and y for our two variables).
- The slope is constant (between any two points, the rise over run, or change in y over the change in x, is always the same).
- The table has (or suggests) the point (0, 0).
Example 1: A Table That Is A Direct Variation
Consider the table:
| x | y |
|---|---|
| 0 | 0 |
| 1 | 3 |
| 2 | 6 |
| 3 | 9 |
| 4 | 12 |
direct variation
relationship y = 3x.
This table is a direct variation, since:
- There are only two variables (x and y columns in the table)
- The slope is constant: k = 3.
- The table contains the point (0, 0).
Example 2: A Table That Is Not A Direct Variation
Consider the table:
| x | y | z |
|---|---|---|
| 0 | 0 | 0 |
| 1 | 2 | 5 |
| 2 | 7 | 8 |
| 3 | 8 | 9 |
| 4 | 10 | 12 |
relationship between
variables x, y, and z.
This table is not a direct variation, since:
- There are three variables: x, y, and z.
Example 3: A Table That Is Not A Direct Variation
Consider the table:
| x | y |
|---|---|
| 0 | 1 |
| 1 | 3 |
| 2 | 5 |
| 3 | 6 |
| 4 | 6 |
relationship that is not direct variation.
This table is not a direct variation, since:
- The slope is not constant.
Example 4: A Table That Is Not A Direct Variation
Consider the table:
| x | y |
|---|---|
| 0 | 1 |
| 1 | 3 |
| 2 | 6 |
| 3 | 9 |
| 4 | 12 |
direct variation
relationship y = 3x.
This table is not a direct variation, since:
- The point (0, 0) is not in the table.
How To Tell If A Graph Is A Direct Variation
To tell if a graph is a direct variation, look for a line that passes through the origin. In particular, this means:
- The graph is a line (not a parabola or other curve).
- The slope is constant (there is only one line, not a piecewise combination of two or more lines).
- The line goes through the origin (the point (0, 0)).
Example 1: A Graph That Is A Direct Variation
Consider the graph:
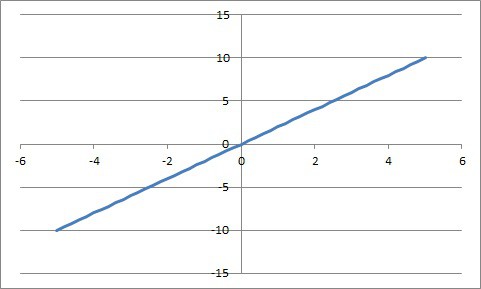
This graph is a direct variation, since:
- The graph is a line (not a parabola or other curve).
- The slope is constant (the slope is always k = 2).
- The line goes through the origin (the point (0, 0)).
Example 2: A Graph That Is Not A Direct Variation
Consider the graph:
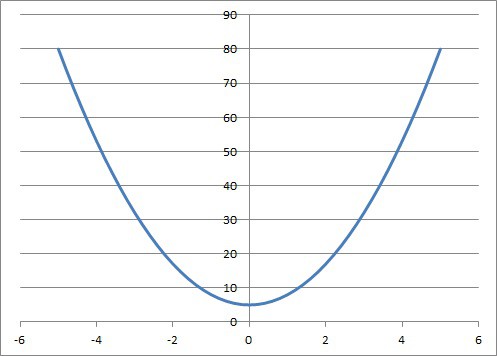
This graph is not a direct variation, since:
- The graph is not a line (it is a parabola).
Example 3: A Graph That Is Not A Direct Variation
Consider the graph:
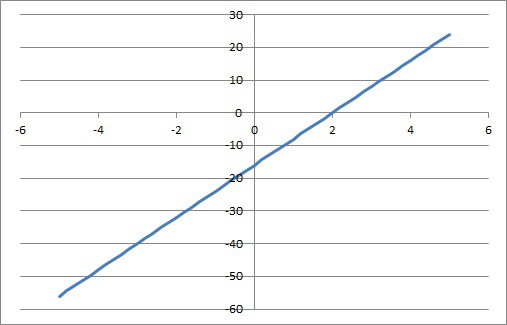
This graph is not a direct variation, since:
- The line does not pass through the origin (its y-intercept is ).
How To Solve Direct Variation
To solve direct variation, plug in matching values of variables to find k. Then, if necessary, use the value of k with a value of x or y to find the other variable’s value.
Example 1: Solving A Direct Variation For k
Let’s say that there is a direct variation between x and y. That means:
- y = kx
for some constant k.
Let’s assume we know that y = 15 when x = 3. Plugging in these values of x and y, we get:
- y = kx
- 15 = k(3)
- 5 = k
So, the constant of variation is 5, and our equation is y = 5x.
Example 2: Solving A Direct Variation
Let’s say that there is a direct variation between x and y. That means:
- y = kx
for some constant k.
Let’s assume we know that y = 12 when x = 2. What is y when x = 7?
First, we need to find k. Plugging in x = 2, y = 12, we get:
- y = kx
- 12 = k(2)
- 6 = k
So, the constant of variation is 6, and our equation is y = 6x.
Now, we can find y when x = 7:
- y = 6x
- y = 6(7)
- y = 42
So, y = 42 when x = 7.
Can Direct Variation Be Negative?
Direct variation can be negative. To be more precise, the constant of variation k can be less than zero (k < 0).
In practical terms, k < 0 means that y decreases as x increases. Similarly, y increases as x decreases.
For example, if k = -5, then we have the direct variation y = -5x.
When x increases by 1, y will decrease by 5.
When x decreases by 1, y will increase by 5.
The graph will be a line that goes through the origin (0, 0) and moves down as we move from left to right. The slope is -5 = -5 / 1 = rise / run, so we move down 5 units for every unit we move right.
Can Direct Variation Be A Fraction?
Direct variation can be a fraction. To be more precise, the constant of variation k can be a rational number (or even an irrational number).
In practical terms, if k is a fraction, we can interpret it as the slope (rise over run). So, if k is the fraction a / b, then we can write:
- y = kx
- y = (a / b)x
- y = ax / b
- by = ax
Another interpretation is that every time x increases by b, y increases by a.
For example, if k = 2 / 3, then every time x increases by 3, y increases by 2. Every time x decreases by 3, y decreases by 2.
Note that k can be both negative and a fraction. For example, we could have k = -5 / 4.
Can A Parabola Be A Direct Variation?
A parabola cannot be direct variation. Remember that the graph of a parabola comes from a quadratic equation.
Every quadratic equation has a quadratic term which contains x2 (an exponent of 2). However, direct variation only applies to an equation y = kx, which has no x2 term.
(You can learn more about parabolas in my article here.)
Can Direct Variation Have Exponents?
Direct variation cannot have exponents other than 1 for the variables x and y. This is because direct variation is a linear relationship between x and y.
If the variables x and y have exponents other than 1, then we do not have a direct variation relationship. For example:
- y = 5x2 is not a direct variation, since we have an exponent of 2 for the x variable.
- y = 4x3 is not a direct variation, since we have an exponent of 3 for the x variable.
- y2 = 6x is not a direct variation, since we have an exponent of 2 for the y variable.
Conclusion
Now you know what direct variation is and how to tell from an equation, table, or graph. You also have some examples that do not show direct variation between two variables.
I hope you found this article helpful. If so, please share it with someone who can use the information.
Don’t forget to subscribe to my YouTube channel & get updates on new math videos!
~Jonathon