
If you want to visualize a range of values or graph the solutions to an inequality, you will probably use a number line. However, there is some notation that you should be aware of, and some questions you should know the answers to.
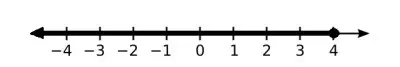
So, what is a number line? A number line is a visual way to picture the real numbers. A number line has numbers labeled (…, -3, -2, -1, 0, 1, 2, 3, …) and has negative numbers to the left and positive numbers to the right. You can use a number line to graph solutions of inequalities or to show a range of values.
Of course, we may need to use open circles or closed circles to show whether an endpoint is excluded from or included in a range of values.
In this article, we’ll talk about number lines and why we might use them. We’ll also look at some examples of number lines, and we’ll answer some common questions about them to clear up any confusion.
Let’s get started.
What Is A Number Line?
A number line displays the real numbers on a horizontal graph. Negative numbers are on the left, and positive numbers are on the right, with 0 separating positive from negative numbers.

Of course, it is impossible to label every single real number (since there are infinitely many!) Instead, we usually just label some of the integers on a number line.
Remember that integers have no fraction or decimal part. Integers include numbers like:
- …, -3, -2, -1, 0, 1, 2, 3, …
When we label a number on a number line, we usually put a vertical tick mark to mark the number’s place, with the number written below the tick mark.
When we graph a single number on a number line, we usually put a dot at the point where the number lies. You can label the dot above or below (as space allows – see the picture below).
When we graph a range of values on a number line, we put dots at the endpoints. The dot may be closed (filled in) or open (empty or not filled in).
This will depend on whether the endpoint is included in the range of values (we will go into more detail on this later).
Why Do We Use A Number Line?
A number line is used for a few different purposes:
- Position: to show where a number lies in relation to whole numbers (e.g. “√30 is between 5 and 6”).
- Ordering: to show how two (or more) numbers compare to each other. (e.g. “5.5 is greater than 4.5, since 5.5 is further right on the number line than 4.5”)
- Range of Values: to show an entire range of values (e.g. “all values in the range [2, 3], or numbers between 2 and 3, including the endpoints”)
- Graph An Inequality In One Variable: as above, to show an entire range of values that satisfies an inequality (e.g. “all solutions to 5x – 3 <= 12”)
- Graph A Compound Inequality In One Variable: we can also graph multiple inequalities and find their overlap to graph a compound inequality (e.g. “all solutions to x > 2 AND x < 5)
For the last few uses mentioned above, we need to be familiar with certain notation and how to convert between various forms.
Number Line Notation
When graphing a range of values on a number line, we use a certain notation to show the endpoints and intermediate values.
Number Line Notation For Endpoints (Circles Or Dots)
To show the endpoints of a range of values on a number line, we use circles or dots. We follow the rule that:
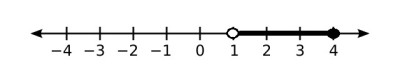
- If the endpoint is included in the range of values (<= or >= symbols), then we use a closed (filled-in) circle.
- If the endpoint is excluded from the range of values (< or > symbols), then we use an open (empty or not filled-in) circle.
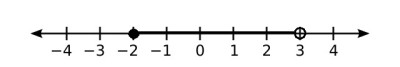
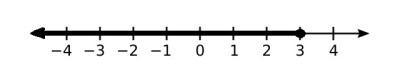
In the example below, the interval is [-2, 3), which includes the left endpoint (x = -2, closed circle) and excludes the right endpoint (x = 3, open circle).
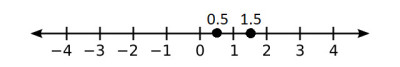
Number Line Notation For Intermediate Values (Shading)
To show the intermediate values for a range of values on a number line, we “shade” the line by making it thicker between the two endpoints.
You can see a number line with the intermediate values shaded below.
This notation (circles at endpoints and shaded intermediate values) is an alternative way to graph a range of numbers expressed as an inequality or in interval notation.
It is helpful to know how to switch between these forms.
The table below shows equivalent inequalities and interval notations.
| Interval Notation | Inequality Notation |
|---|---|
| (1, ∞) | x > 1 |
| [1, ∞) | x >= 1 |
| (-∞, 1) | x < 1 |
| (-∞, 1] | x <= 1 |
| (1, 3) | 1 < x < 3 |
| [1, 3) | 1 <= x < 3 |
| (1, 3] | 1 < x <= 3 |
| [1, 3] | 1 <= x <= 3 |
(curved) means we exclude the
endpoint (strict inequality, meaning
< or >). A square bracket means we
include the endpoint (inclusive
inequality, meaning <= or >=).
Note that when there is no upper limit (such as for the inequality x > 1), we shade the entire number line to the right of the endpoint, along with the arrow at the right (as seen below):
Likewise, when there is no lower limit (such as for the inequality x < 1), we shade the entire number line to the left of the endpoint, along with the arrow at the left (as seen below):
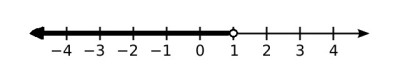
What Does An Open Circle Mean On A Number Line? (Open Dot On A Number Line)
As mentioned earlier, an open circle (also called an empty circle or open dot) means that the endpoint is not included in the range of values.
This notation is used when graphing intervals with parentheses, such as (2, 3), or when graphing a strict inequality, such as x < 3.
What Does A Closed Circle Mean On A Number Line? (Closed Dot On A Number Line)
As mentioned earlier, a closed circle (also called a filled circle or filled-in dot) means that the endpoint is included in the range of values.
This notation is used when graphing intervals with square brackets, such as [2, 3], or when graphing an inequality that is inclusive of the endpoint, such as x <= 3.
Number Line Examples
Let’s look at some examples of how to represent various numbers on a number line.
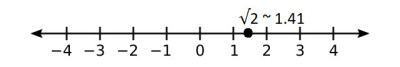
Example 1: How To Represent √2 On A Number Line
We know that √2 will be between 1 and 2 on the number line, since:
- 12 = 1*1 = 1
- 22 = 2*2 = 4
and 2 is between 1 and 4.
If we use a calculator, we get a value of about 1.41 for √2. Since 1.5 is halfway between 1 and 2, then √2 (~1.41) is a little bit to the left of 1.5.
You can see this illustrated on the graph below.
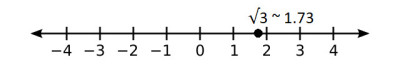
Example 2: How To Represent √3 On A Number Line
We know that √3 will be between 1 and 2 on the number line, since:
- 12 = 1*1 = 1
- 22 = 2*2 = 4
and 3 is between 1 and 4.
If we use a calculator, we get a value of about 1.73 for √3.
Now, 1.5 is halfway between 1 and 2. Likewise, 1.75 is halfway between 1.5 and 2.
So, √3 (~1.73) is just to the left of 1.75.
You can see this illustrated on the graph below.
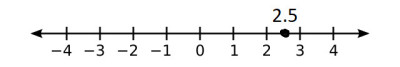
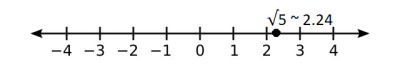
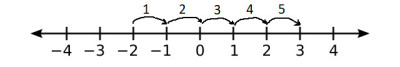
Example 3: How To Represent √5 On A Number Line
We know that √5 will be between 2 and 3 on the number line, since:
- 22 = 2*2 = 4
- 32= 3*3 = 9
and 5 is between 4 and 9.
If we use a calculator, we get a value of about 2.24 for √5.
Now, 2.5 is halfway between 2 and 3. Likewise, 2.25 is halfway between 2 and 2.5.
So, √5 (~2.24) is just to the left of 2.24.
You can see this illustrated on the graph below.
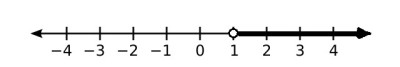
Example 4: How To Graph An Inequality On A Number Line
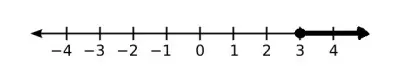
Let’s graph the inequality x <= 3 on a number line.
Since we have an inequality that includes the endpoint x = 3, we use a closed (filled-in) circle.
Since we want values less than or equal to 3, we shade values to the left of 3 (including the arrow at the end of the number line).
Example 5: How To Graph An Inequality On A Number Line
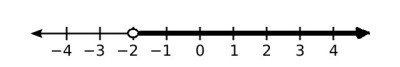
Let’s graph the inequality x > -2 on a number line.
Since we have a strict inequality that excludes the endpoint x = -2, we use an open (empty) circle.
Since we want values greater than -2, we shade values to the right of -2 (including the arrow at the end of the number line).
Example 6: How To Graph A Compound Inequality On A Number Line (OR)
Let’s graph the inequality x >= 3 OR x < -3 on a number line. We need to graph 2 different inequalities and combine them (since OR means to add the solutions together).
First, since we have an inequality that includes the endpoint x = 3, we use a closed (filled-in) circle.
Since we want values greater than or equal to 3, we shade values to the right of 6 (including the arrow at the end of the number line).
Next, since we have a strict inequality that excludes the endpoint x = -3, we use an open (empty) circle.
Since we want values less than -3, we shade values to the left of -3 (including the arrow at the end of the number line).
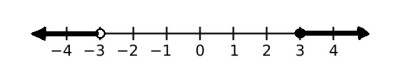
So, the solution set to this compound inequality has two disconnected parts.
Example 7: How To Graph A Compound Inequality On A Number Line (AND)
Let’s graph the inequality x <= 4 AND x > 1 on a number line. We need to graph 2 different inequalities and find their overlap (since AND means to find the overlap).
First, since we have an inequality that includes the endpoint x = 4, we use a closed (filled-in) circle.
Since we want values less than or equal to 8, we shade values to the left of 4 (including the arrow at the end of the number line).
Next, since we have a strict inequality that excludes the endpoint x = 1, we use an open (empty) circle.
Since we want values greater than 1, we now only shade values to the right of 1 (including the arrow at the end of the number line) and to the left of 4.
So, the solution set to this compound inequality is the overlap, which is 1 < x <= 4.
Questions About Number Lines
Below, we will answer some common questions about number lines concerning the number zero, endpoints, and irrational numbers.
Do You Count 0 On A Number Line?
When you find the distance between two numbers on a number line, you should count 0.
For example, to find the distance between -2 and 3, we keep count as follows:
- -2 to -1 is 1
- -1 to 0 is 2
- 0 to 1 is 3
- 1 to 2 is 4
- 2 to 3 is 5
This makes sense, since the difference 3 – (-2) = 3 + 2 = 5.
Does A Number Line Have To Start At 0?
A number line does not have to start at 0. Although 0 is included on a number line, it may not be shown (labeled) in some cases.
For example, let’s say you want to graph the solution to the compound inequality -200 < x < -100. Since 0 is not included in the range of values, and is not even close to the right endpoint, you probably would not show 0 on your number line (it would be far to the right in the picture below).
Does The Number Line End?
The number line does not end. It goes on forever in either direction (to negative infinity to the left, and to positive infinity to the right).
Of course, when graphing a range of values, you will usually just label the numbers that are relevant.
Can Irrational Numbers Be Represented On A Number Line?
Irrational numbers can be represented on a number line. It is a good idea to get a decimal approximation and graph an irrational number close to the approximate decimal value.
For example, in the example from earlier, we approximated √5 as ~2.24, and observed that 2.5 is halfway between 2 and 3, and 2.25 is halfway between 2 and 2.5.
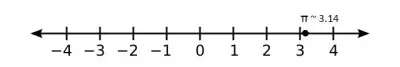
Can Pi Be Represented On A Number Line?
Pi can be represented on a number line. Again, it is a good idea to get a decimal approximation (around 3.14) and graph pi close to this approximate decimal value.
Conclusion
Now you know a bit about number lines, including what they are and what they are used for. You also have a better idea of how we can use them to graph inequalities in one variable.
I hope you found this article helpful. If so, please share it with someone who can use the information.

Don’t forget to subscribe to our YouTube channel & get updates on new math videos!