
Solving and graphing quadratic equations is one thing, but quadratic inequalities add another layer of work to be done. However, if you have a method, you can solve these problems without much trouble.
So, how do you solve & graph quadratic inequalities? To solve a quadratic inequality, first convert it to standard form. Next, identify the case you are in, and find the zeros of the quadratic. Then, graph the corresponding parabola from the quadratic. Finally, shade the appropriate region on the graph based on signs and the inequality symbol.
Of course, some cases are easier to solve and graph than others, but there is a way to do every problem.
In this article, we’ll take a closer look at the steps to solve and graph quadratic inequalities. We’ll pay special attention to the possible cases for the solution sets and what to do in each situation.
Let’s get started.
How To Solve & Graph Quadratic Inequalities
There are 7 steps to take if you want to solve and graph a quadratic inequality. Doing them in this order ensures that you won’t miss anything along the way:
- 1. Convert the quadratic inequality to standard form with a > 0.
- 2. Find the value of vy (the y-coordinate of the vertex of the parabola).
- 3. Use vy to identify the case for the solutions.
- 4. Find the zeros of the quadratic.
- 5. Write the solution set for the quadratic inequality.
- 6. Graph the parabola corresponding to the quadratic.
- 7. Shade the appropriate region on the graph, based on the inequality sign.
First, we’ll explain each of these steps in more detail. Then, we’ll look at some examples to make things clear.
1. Convert The Quadratic Inequality To Standard Form With a > 0
Standard form just means that one side of the inequality is zero. This would only require subtraction.
However, we want to take the extra step of making a > 0 (that is, a positive coefficient for x2). Sometimes this will be faster with multiplication by -1, which will require us to switch the direction of the inequality symbol.
For example, let’s say we have the quadratic inequality -2x2 + 3x + 4 > 5. To convert to standard form with a > 0:
- -2x2 + 3x + 4 > 5 [original inequality]
- -2x2 + 3x + 4 – 5 > 5 – 5 [subtract 5 from both sides]
- -2x2 + 3x – 1 > 0
- -1(-2x2 + 3x – 1) < 0 [multiply both sides by -1, and switch direction of inequality symbol]
- 2x2 – 3x + 1 < 0
Now our quadratic inequality is in standard form, with one side equal to zero. We also have a > 0 (since a = 2), which makes our work easier in future steps.
2. Find the Value of Vy (The y-coordinate Of The Vertex Of The Parabola)
Remember that for a quadratic f(x) = ax2 + bx + c, we can graph the corresponding parabola. This parabola has a vertex with coordinates (vx, vy), where:
- vx = -b / 2a
- vy = (4ac – b2) / 4a
So, to find vy (the y coordinate of the vertex), all we need to do is plug a, b, and c into vy, the formula for the y coordinate of the vertex of a parabola.
For example, let’s go back to the inequality we converted to standard form earlier:
- 2x2 – 3x + 1 < 0
Here, we have a = 2, b = -3, and c = 1.
Substituting these into the vy formula gives us:
- vy = (4ac – b2) / 4a
- vy = (4(2)(1) – (-3)2) / 4(2)
- vy = (8 – 9) / 8
- vy = -1 / 8
So, the y coordinate of the vertex of the parabola is -1/8.
3. Use vy To Identify The Case For The Solutions
There are 6 cases for the solutions of the quadratic inequality, depending on the sign of vy and the direction of the inequality symbol:
Case 1: vy > 0
In this case, the y-coordinate of the vertex is positive (it is above the x-axis). Since a > 0, the parabola opens upward, which means the parabola is always above the x-axis, and the quadratic f(x) is always positive.
The following 4 subcases are possible for vy > 0:
- f(x) > 0: every x value in the domain is a solution.
- f(x) >= 0: every x value in the domain is a solution.
- f(x) < 0: there is no solution.
- f(x) <= 0: there is no solution.
Case 2: vy = 0
In this case, the y-coordinate of the vertex is positive (it lies on the x-axis). Since a > 0, the parabola opens upward, which means the parabola is always on or above the x-axis, and the quadratic f(x) is always positive or zero.
The following 4 subcases are possible for vy = 0:
- f(x) > 0: every x value in the domain is a solution, except for vx, the x-coordinate of the vertex.
- f(x) >= 0: every x value in the domain is a solution.
- f(x) < 0: there is no solution.
- f(x) <= 0: the only solution is vx, the x-coordinate of the vertex.
Case 3: vy < 0
In this case, the y-coordinate of the vertex is negative (it is below the x-axis). Since a > 0, the parabola opens upward, which means the parabola is sometimes above the x-axis, sometimes below the x-axis, and sometimes intersecting the x-axis (this is where we find the zeros).
So, f(x) can take values that are positive, negative, or zero. In fact, f(x) has two zeros in this case, r and s (r < s).
The following 4 subcases are possible for vy < 0:
- f(x) > 0: some x values in the domain are solutions: x < r and x > s.
- f(x) >= 0: some x values in the domain are solutions: x <= r and x >= s.
- f(x) < 0: some x values in the domain are solutions: r < x < s.
- f(x) <= 0: some x values in the domain are solutions: r <= x <= s.
Continuing with our example from earlier, we see that vy = -1/8 puts us in Case 3, vy < 0. We also have f(x) < 0, which is the 3rd subcase.
This means that some x values in the domain are solutions: the x values between the zeros of the quadratic.
The following table summarizes the cases for vy, the sign of the inequality, and the solutions of the quadratic inequality.
| Cases | Case 1 vy > 0 | Case 2 vy = 0 | Case 3 vy < 0 |
|---|---|---|---|
| f(x) > 0 | all x | all x except vx | x < r and x > s |
| f(x) >= 0 | all x | all x | x <= r and x >= s |
| f(x) < 0 | none | none | r < x < s |
| f(x) <= 0 | none | vx | r<=x<=s |
sign of the inequality, and the solutions
of the quadratic inequality when a > 0.
4. Find The Zeros Of The Quadratic
You can find the zeros of a quadratic in multiple ways. One way is to factor the quadratic and set the factors equal to zero.
Another way is to use the quadratic formula. This is the most versatile method, since it will give us the zeros of any quadratic (no matter how difficult it is to factor!)
Once we have the zeros of the quadratic (call them r and s), we can write out the solution sets for the inequality and then proceed to graph the parabola and shade the appropriate regions.
In our example from earlier, the quadratic is f(x) = 2x2 – 3x + 1, with a = 2, b = -3, and c = 1.
Using the quadratic formula (pictured below), we find:
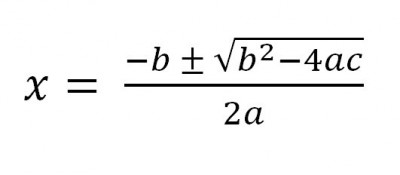
r = 1/2 and s = 1 are the solutions for the quadratic (note that r < s).
5. Write The Solution Set For The Quadratic Inequality
Now that we have the case and the zeros, we can write the solution set for the quadratic inequality.
Following along with the example from earlier, remember that we were in Case 3 (vy < 0) and subcase 3 (f(x) < 0).
This means that our solution set is r < x < s, or ½ < x < 1. We can also write this set as (1/2, 1).
Remember that an open parenthesis means that the endpoint is not included in the set.
6. Graph The Parabola Corresponding To The Quadratic
Now we graph the parabola using the following type of curve:
- a solid curve for inclusive inequalities (>= or <= symbols)
- a dashed curve for strict inequalities (> or < symbols)
Going back to our example from before, let’s say we want to graph y < f(x). In that case, we will use a dashed line to graph the parabola.
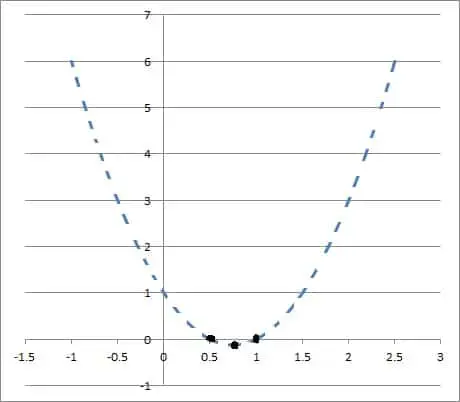
We know that the zeros are r = 1/2 and s = 1. We also know that the vertex is at the point (vx, vy), or (3/4, -1/8).
If we plot these three points to start our graph, we can sketch in the shape of a parabola that intersects all three points.
The graph of f(x) = 2x2 – 3x + 1 is shown below (drawn as a dashed curve).
7. Shade The Appropriate Region Of The Graph, Based On The Inequality Sign
To shade the appropriate region, we shade above or below the curve depending on the sign of the inequality:
- For y > f(x) > 0 or y >= f(x), we shade above the parabola curve.
- For y < f(x) or y <= f(x), we shade below the parabola curve.
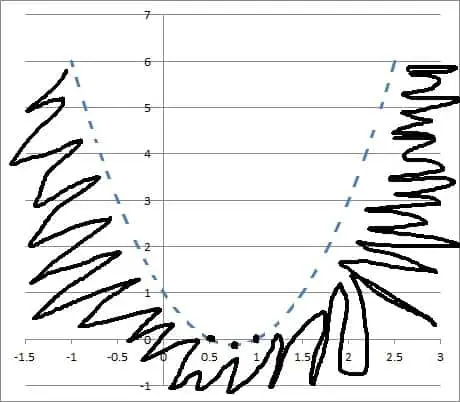
Going back to our example from earlier, if we want to graph y < f(x), we will want to shade below the curve.
Example: Solve & Graph A Quadratic Inequality
Now let’s walk through the steps to solve and graph the quadratic inequality 2x2 + 6x – 12 > 8. We’ll take it step by step.
Step 1 is to convert to standard form with a > 0.
We can just subtract 8 from both sides to get:
- 2x2 + 6x – 20 > 0
Step 2 is to find vy = (4ac – b2) / 4a:
vy = (4ac – b2) / 4a
vy = (4(2)(-20) – 62) / 4(2)
vy = (-160 – 36) / 8
vy = -24.5
Step 3 is to use vy to identify the case for the solutions.
Since vy < 0, we are in Case 3. Since f(x) > 0, we are in subcase 1. The solutions are x < r and x > s.
Step 4 is to find the zeros of the quadratic.
After using the quadratic formula with a = 2, b = 6, and c = -20, we get r = -5 and s = 2.
Step 5 is to write the solution set for the quadratic inequality.
We have x < r and x > s, or x < -5 and x > 2.
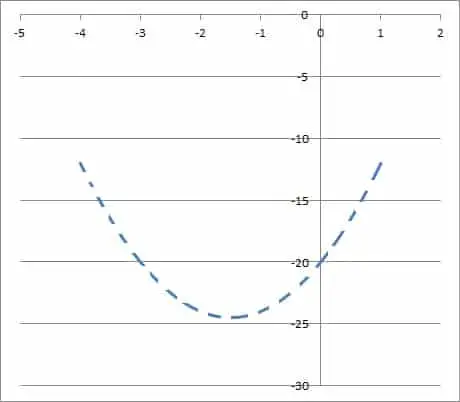
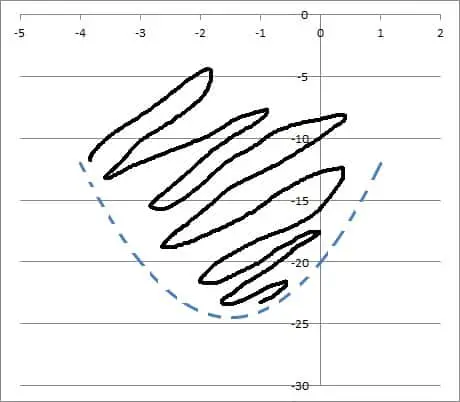
Step 6 is to graph the parabola corresponding to the quadratic function f(x) = 2x2 + 6x – 12.
We use a dashed curve, since we have a strict inequality (the > symbol).
Step 7 is to shade the appropriate region.
If we have the inequality y > f(x), then we want to shade above the curve.
Conclusion
Now you know how to solve and graph quadratic inequalities. Hopefully this method makes things a little easier to understand and a little less overwhelming.
You can learn more about inequalities with no solutions in my article here.
You can learn more about compound inequalities here.
I hope you found this article helpful. If so, please share it with someone who can use the information.
Don’t forget to subscribe to my YouTube channel & get updates on new math videos!
~Jonathon