
Square root functions come up in algebra, pre-calculus, calculus, and other subjects. It is a good idea to know how to graph square roots and other radicals (either to draw them by hand or to verify what a calculator is showing you).
So, how do you graph a square root function? First, find the domain – the radicand cannot be negative. Next, plot some points on the graph, including the one at the end of the domain. Then, pay attention to negative signs, which can “flip” the graph across a line. Finally, connect the points by sketching the shape of the square root function.
Of course, a table of values can help you with graphing your first few points. Also, you need to know the general shape of a square root function and how it changes with different signs.
In this article, we’ll talk about how to graph any square root function. We’ll also take a look at several examples, showing the steps as we go along.
Let’s get started.
How To Graph A Square Root Function
To graph a square root function, there are 4 steps we can take to break down the process:
- 1. Find the domain – this tells us where the graph of the square root function will be defined. Remember that the square root of a negative is imaginary, so we can’t graph it in a 2D real number system. That means we must solve the inequality that makes the radicand greater than or equal to zero.
- 2. Plot some points – this helps us to know where to sketch the square root curve in the next step. Graphing the endpoint of the domain tells us where the graph starts, and graphing a few more points helps us to see the approximate shape of the curve before we draw it.
- 3. Mind the negatives – pay close attention to any negative signs in the square root function. A negative in front of x can flip the function across a vertical axis (such as the y-axis), while a negative in front of the entire square root can flip the function across a horizontal axis (such as the x-axis).
- 4. Sketch the curve – use the general shape of a square root function to connect all of the points from Step 3 when you sketch the curve. The starting point tells you where to begin, and the other points give you an idea of where the curve should go.
Before we look at some examples, let’s refresh our memory on what square root functions look like. We’ll also look at how negative signs affect their appearance.
Here is the graph of the most basic square root function, f(x) = √x:
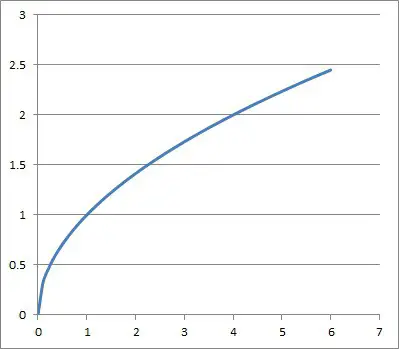
Note that the function is not defined for any x < 0, since the square root of a negative is imaginary. Also note that we only take the principal (positive) square root for any positive x value (for example, the square root of 4 is taken to be 2, not -2 – if we took both, we would not have a function).
If we put a negative sign in front of the x, we flip the curve across the x-axis to get g(x) = √-x:
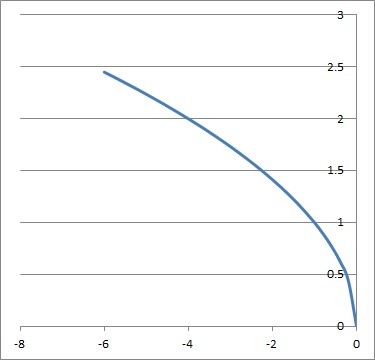
This is the “mirror image” of f(x) = √x, reflected across the x-axis. Note that the function is not defined for any x > 0, since the square root of a negative is imaginary (if x is positive, then –x is negative).
If we put a negative sign in front of the square root, we flip the curve across the y-axis to get h(x) = -√x:
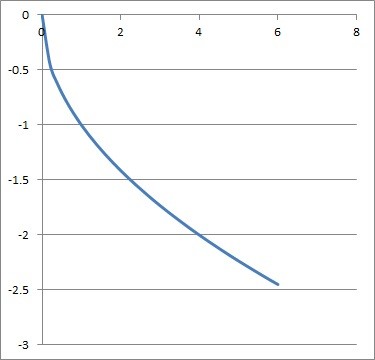
This is the “mirror image” of f(x) = √x, reflected across the y-axis. Note that the function is not defined for any x < 0, since the square root of a negative is imaginary.
Finally, if we put a negative sign in front of the x and in front of the square root, we flip the curve across the x-axis and then the y-axis to get j(x) = -√-x:
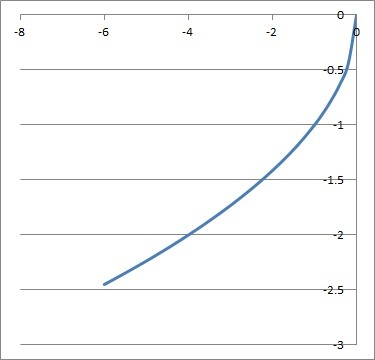
This is another “mirror image” of f(x) = √x, reflected across the x-axis and then the y-axis. Note that the function is not defined for any x > 0, since the square root of a negative is imaginary (if x is positive, then –x is negative).
Now that we have an idea of what square root functions look like (their basic shape), we can try some examples.
Example 1: How To Graph A Square Root Function
Let’s graph the square root function f(x) = 2√x.
First, we find the domain. This means solving for a nonnegative radicand, or x >= 0 (meaning an endpoint of x = 0).
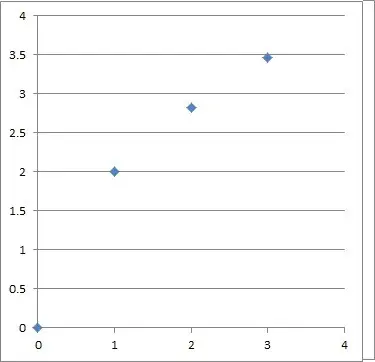
Next, we plot some points. A table will help, starting with the endpoint x = 0:
| x | f(x) |
|---|---|
| 0 | 0 |
| 1 | 2 |
| 2 | 2√2 |
| 3 | 2√3 |
for f(x) = 2√x.
Now we plot these few points on the graph:
Then, we look for any negative signs in the function (here, there are none).
Finally, we sketch the square root curve to connect our points, starting at the endpoint x = 0.
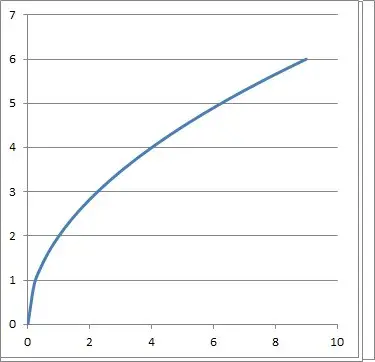
Note that the 2 in front of the square root “doubles” the height of the basic square root function at every point. So, f(x) = 2√x has the same basic shape as √x, but with twice the height (y-value) at each point.
Example 2: How To Graph A Square Root Function
Let’s graph the square root function f(x) = –√(x – 3).
First, we find the domain. This means solving for a nonnegative radicand, or x – 3 >= 0. This gives us a domain of x >= 3 (meaning the endpoint is x = 3).
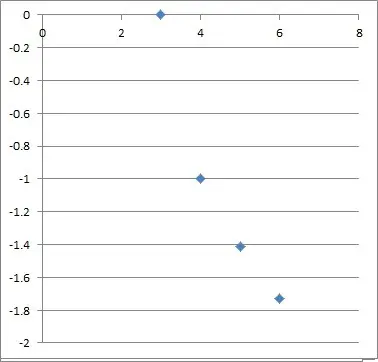
Next, we plot some points. A table will help, starting with the endpoint x = 3:
| x | f(x) |
|---|---|
| 3 | 0 |
| 4 | -1 |
| 5 | -√2 |
| 6 | -√3 |
for f(x) = –√(x – 3).
Now we plot these few points on the graph:
Then, we look for any negative signs in the function. Here, there is a negative in front of the square root, which will “flip” the curve across the x-axis.
Finally, we sketch the square root curve to connect our points, starting at the endpoint x = 3.
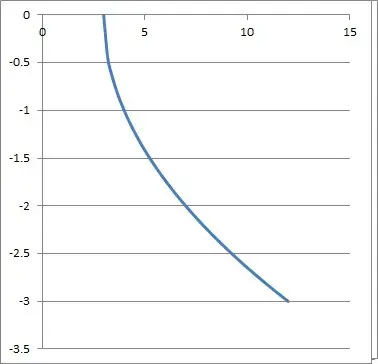
Note that the x – 3 under the radical moves the basic √x curve 3 units to the right. Also, the curve is below the x-axis, since the negative in front of the square root “flips” the basic square root function across the x-axis.
Example 3: How To Graph A Square Root Function
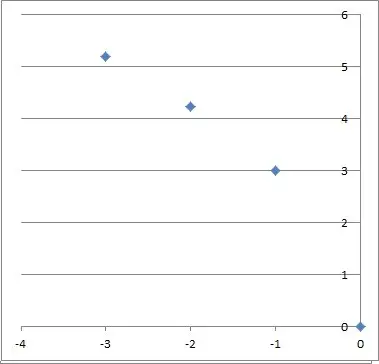
Let’s graph the square root function f(x) = 3√-x.
First, we find the domain. This means solving for a nonnegative radicand, or –x >= 0. This gives us a domain of x <= 0 (meaning the endpoint is x = 0).
Next, we plot some points. A table will help, starting with the endpoint x = 0:
| x | f(x) |
|---|---|
| 0 | 0 |
| -1 | 3 |
| -2 | 3√2 |
| -3 | 3√3 |
for f(x) = 3√-x.
Now we plot these few points on the graph:
Then, we look for any negative signs in the function. Here, there is a negative in front of the x, which will “flip” the curve across the y-axis.
Finally, we sketch the square root curve to connect our points, starting at the endpoint x = 0.
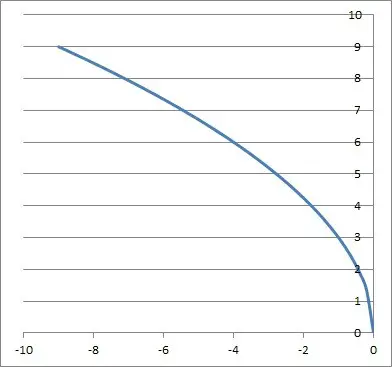
Note that the curve is entirely to the left of the y-axis, since the negative in front of the x “flips” the basic square root function across the y-axis. Also, note that the 3 in front of the radical make the curve 3 times as tall as the basic √x function in all places.
Example 4: How To Graph A Square Root Function
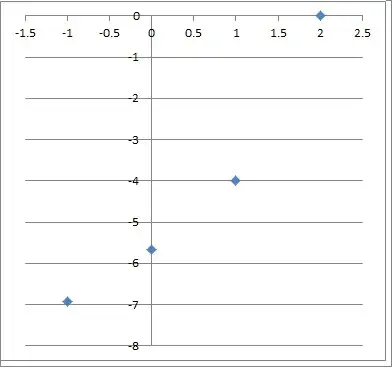
Let’s graph the square root function f(x) = -4√(-x + 2).
First, we find the domain. This means solving for a nonnegative radicand, or –x + 2 >= 0. This gives us a domain of x <= 2 (meaning the endpoint is x = 2).
Next, we plot some points. A table will help, starting with the endpoint x = 2:
| x | f(x) |
|---|---|
| 2 | 0 |
| 1 | -4 |
| 0 | -4√2 |
| -1 | -4√3 |
for f(x) = -4√(-x + 2).
Now we plot these few points on the graph:
Then, we look for any negative signs in the function. Here, there is a negative in front of the x, which will “flip” the curve across the y-axis.
Finally, we sketch the square root curve to connect our points, starting at the endpoint x = 2.
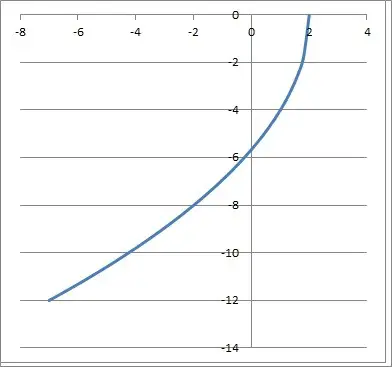
Note that the curve is entirely to the left of the vertical line x = 2, since the negative in front of the x “flips” the basic square root function across the vertical line x = 2.
Also, note that the 4 in front of the radical make the curve 3 times as tall as the basic √x function in all places.
Finally, the negative in front of the 4 “flips” the function across the x-axis.
Example 5: How To Graph A Square Root Function
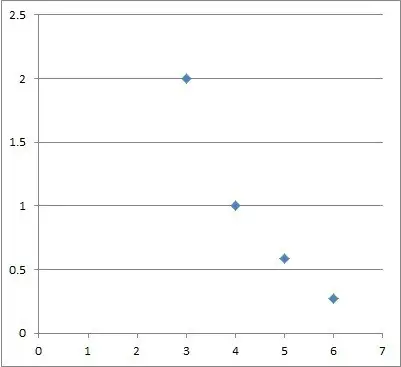
Let’s graph the square root function f(x) = -√(x – 3) + 2.
First, we find the domain. This means solving for a nonnegative radicand, or x – 3 >= 0. This gives us a domain of x >= 3 (meaning the endpoint is x = 3).
Next, we plot some points. A table will help, starting with the endpoint x = 3:
| x | f(x) |
|---|---|
| 3 | 2 |
| 4 | 1 |
| 5 | -√2 + 2 |
| 6 | -√3 + 2 |
for f(x) = -√(x – 3) + 2.
Now we plot these few points on the graph:
Then, we look for any negative signs in the function. Here, there is a negative in front of the square root, which will “flip” the curve across the x-axis.
Finally, we sketch the square root curve to connect our points, starting at the endpoint x = 3.
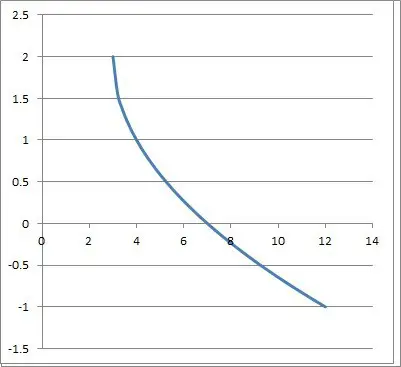
Note that the curve is entirely to the right of the vertical line x = 3.
Also, note that the x – 3 in the radical shifts the function 3 units to the right. Likewise, the +2 shifts the curve two units up.
Finally, the negative in front of the square root “flips” the function across the vertical line x = 3.
Conclusion
Now you know how to graph square roots with no calculator. You also know how negative signs can affect these graphs by “flipping” the curve across an axis.
You can learn how to take the derivative of a square root function here.
I hope you found this article helpful. If so, please share it with someone who can use the information.
Don’t forget to subscribe to my YouTube channel & get updates on new math videos!
~Jonathon