
If you want to graph a quadratic, you will need a few points on the curve. You will also need to know which way the graph opens so that you can draw it properly.
So, how do you graph a quadratic? To graph a quadratic f(x) = ax2 + bx + c, find the vertex & 2 points on the parabola and use the sign of “a” to find the concavity. If there is a double real zero or 2 complex zeros, choose two x-values close to the vertex (one unit left & one unit right) to find two points near the vertex.
Of course, our approach for finding points will vary a bit depending on whether we are given standard form, vertex form, or factored form for a quadratic function.
In this article, we’ll talk about how to graph a quadratic and how to find the information you need to start drawing a picture. We’ll also look at several examples to show how it is done.
Let’s get started.
How To Graph A Quadratic (Tips Draw A Parabola)
To graph a quadratic, we will need a few points on the graph to help us sketch it. It also helps to know the general shape of a parabola and which way the curve will open (up or down).
Here are three helpful tips we can use to draw a parabola from a quadratic function.
Use The Zeros To Graph A Quadratic Function
When we graph a quadratic function (or any function), it helps to know the zeros. Remember that the zeros of a function are the x-values (input) that yield a y-value (output) of zero.
A quadratic function f(x) = ax2 + bx + c has discriminant D = b2 – 4ac. The discriminant tells us about the zeros of a quadratic function according to the following cases:
- D > 0 (positive discriminant): the quadratic function has two distinct real zeros.
- D = 0 (zero discriminant): the quadratic function has one repeated (double) real zero.
- D > 0 (negative discriminant): the quadratic function has two complex conjugate zeros.
In the first case (D > 0), we will have two real zeros r and s. We can use the two points (r, 0) and (s, 0) on the parabola to help us get started with the graph.
In the second case (D = 0), we have one double zero r. We can use the point (r, 0) as the vertex (maximum or minimum) to help us get started with the graph.
In the third case (D < 0), the complex roots do not show up on the graph.
In the second and third cases, we will need to use a horizontal line to find other points on the parabola to help us draw the graph (more on this in later examples).
Use The Vertex Of A Parabola To Graph A Quadratic Function
When we graph a quadratic function, it also helps to know the vertex of the corresponding parabola. Remember that the vertex of a parabola is the point that represents the maximum or minimum value of the function (depending on whether the parabola is concave or convex – more on this later).
The x-coordinate of a parabola’s vertex is the average of the two zeros. So, if the zeros are r and s, we add them to get (r + s) / 2.
For a quadratic function f(x) = ax2 + bx + c, the quadratic formula gives us:
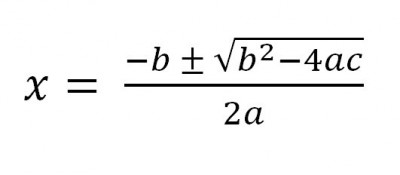
When we add the two solutions, the radical terms cancel and we get –b / a after we combine like terms. After dividing the result by 2, we find that the x-coordinate of the parabola’s vertex is x = -b / 2a.
If we have a quadratic in factored form, we can find the zeros and take their average to get the x-coordinate of the vertex:
- f(x) = a(x – r)(x – s) [factored form of a quadratic function]
If we have a quadratic in vertex form, we can easily read the vertex (h, k) from the equation:
- f(x) = a(x – h)2 + k [vertex form of a quadratic function]
If you need a refresher on how to find the vertex of a parabola, check out this article.
You can also find the answers to some common vertex questions here.
Use Concavity Of A Parabola To Graph A Quadratic Function
Finally, we can use concavity of a parabola to help us graph a quadratic function. The concavity tells us whether the curve will open up (like a cup) or down (like a dome).
The concavity of a parabola is determined by the quadratic coefficient of the corresponding quadratic function:
- Convex (concave up): if a > 0, the parabola is convex, and it opens upward (like a cup – the shape would hold water).
- Concave (concave down): if a < 0, the parabola is concave, and it opens downward (like a dome – water would roll off the shape).
How To Graph A Quadratic Function (Quadratic Equation Graph)
Once we know the zeros (or two other point), the vertex, and the concavity of a parabola, it is easy to graph. Let’s take a look at some examples to see how it is done.
How To Graph A Quadratic Function In Standard Form
Let’s start with some quadratic functions in standard form.
Example 1: Graphing A Quadratic Function In Standard Form
Consider the quadratic function
- f(x) = x2 – 6x + 8
First, we will find the zeros. We could use the quadratic formula, but we can also factor easily as:
- f(x) = (x – 2)(x – 4)
So the zeros of this quadratic function are x = 2 and x = 4. This means the points (2, 0) and (4, 0) are on the graph (the parabola we draw must go through these two points).
Next, we will find the vertex. For this quadratic function, we have a = 1, b = -6, and c = 8, so the x-coordinate of the vertex is:
- x = -b / 2a
- x = -(-6) / 2(1)
- x = 3
We can then substitute x = 3 into the quadratic function to find the y-coordinate of the vertex:
- f(x) = (x – 2)(x – 4)
- f(3) = (3 – 2)(x – 3)
- f(3) = (1)(-1)
- f(3) = -1
Then the vertex of the parabola is the point (3, -1).
Now, since a = 1, we know that a > 0 and the parabola is convex (concave up), meaning that it opens upward.
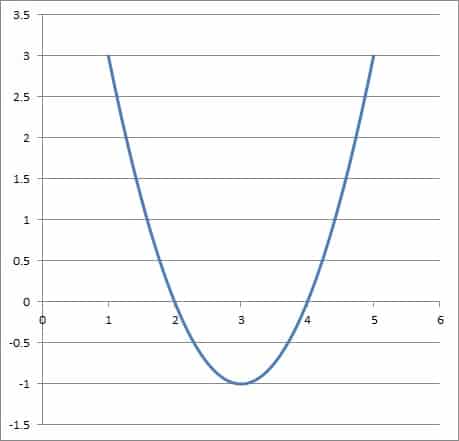
Finally, we draw the parabola that satisfies all of this information:
- Zeros at (2, 0) and (4, 0)
- Vertex at (3, -1)
- Concave up
You can see the graph of the quadratic function f(x) = x2 – 6x + 8 below.
Example 2: Graphing A Quadratic Function In Standard Form
Consider the quadratic function
- f(x) = -x2 + 8x – 16
First, we will find the zeros. We could use the quadratic formula, but we can also factor easily as:
- f(x) = -x2 + 8x – 16
- f(x) = -(x2 – 8x + 16) [factor out -1]
- f(x) = -(x – 4)2 [factor as a perfect square trinomial]
So this quadratic function has a double zero at x = 4. This means the point (4, 0) is on the graph (the parabola we draw must go through this point).
Note that the point (4, 0) is also the vertex of the parabola in this case (the case of a double real zero).
In order to find two more points, we will travel one unit to the left from the vertex (so x = 3) and one unit to the right of the vertex (so x = 5).
For x = 3, this gives us:
- f(x) = -(x – 4)2
- f(3) = -(3 – 4)2
- f(3) = -(-1)2
- f(3) = -1
For x = 5, this gives us:
- f(x) = -(5 – 4)2
- f(3) = -(5 – 4)2
- f(3) = -(1)2
- f(3) = -1
Note that we get the same y-value, due to the symmetry of a parabola (since the values x = 3 and x = 5 are both the same distance from the vertex x = 4, but in different directions).
This means that the points (3, -1) and (5, -1) are both on the parabola.
Now, since a = -1, we know that a < 0 and the parabola is concave (concave down), meaning that it opens downward.
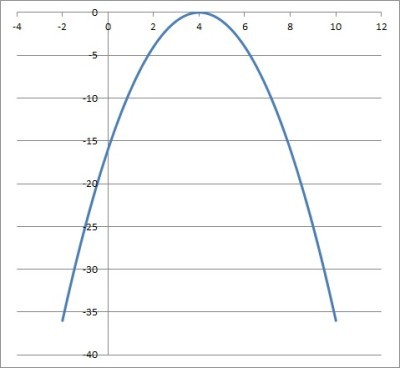
Finally, we draw the parabola that satisfies all of this information:
- Goes through points (3, -1) and (5, -1)
- Vertex at (4, 0)
- Concave down
You can see the graph of the quadratic function f(x) = -x2 + 8x – 16 below.
Example 3: Graphing A Quadratic Function In Standard Form
Consider the quadratic function
- f(x) = x2 + 4
First, we will find the zeros. The quadratic formula gives us zeros of x = 2i and x = -2i (these are imaginary numbers).
These values will not show up on the graph. However, we know that we can take the average of these two to find the x-coordinate of the vertex of the parabola.
This gives us (2i + -2i) / 2 = 0. Then the y-value of the vertex is:
- f(x) = x2 + 4
- f(0) = 02 + 4
- f(0) = 4
So the vertex of the parabola is the point (0, 4).
In order to find two more points, we will travel one unit to the left from the vertex (so x = -1) and one unit to the right of the vertex (so x = 1).
For x = -1, this gives us:
- f(x) = x2 + 4
- f(-1) = (-1)2 + 4
- f(-1) = 1 + 4
- f(-1) = 5
For x = 1, this gives us:
- f(x) = x2 + 4
- f(1) = (1)2 + 4
- f(1) = 1 + 4
- f(1) = 5
Note that we get the same y-value, due to the symmetry of a parabola (since the values x = -1 and x = 1 are both the same distance from the vertex x = 0, but in different directions).
This means that the points (-1, 5) and (1, 5) are both on the parabola.
Now, since a = 1, we know that a > 0 and the parabola is convex (concave up), meaning that it opens upward.
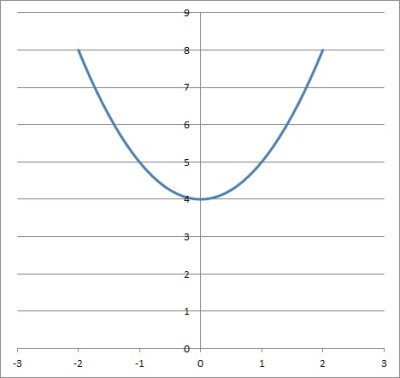
Finally, we draw the parabola that satisfies all of this information:
- Goes through points (-1, 5) and (1, 5)
- Vertex at (0, 4)
- Concave up
You can see the graph of the quadratic function f(x) = x2 + 4 below.
How To Graph A Quadratic Function In Vertex Form
To graph a quadratic function in factored form, the basic steps are as follows:
- Find the vertex (h, k) from the vertex form f(x) = a(x – h)2 + k.
- Find two x-values: the first is one unit left of the vertex, and the other is one unit right of the vertex. Use the function to find the corresponding y-values (they should be the same, due to symmetry of a parabola).
- Find the concavity by using the sign of the coefficient a.
Now we will try graphing a quadratic function give in vertex form.
Example: Graphing A Quadratic Function In Vertex Form
Consider the quadratic function
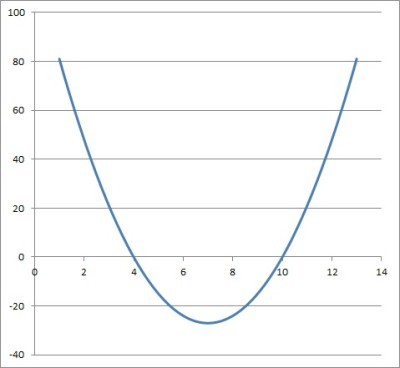
- f(x) = 2(x – 4)2 + 7
We know that in vertex form, the point (h, k) is the vertex of the parabola. Here, we have h = 4 and k = 7, so the vertex is the point (4, 7).
To find two other points on the parabola, we will travel one unit to the left from the vertex (so x = 3) and one unit to the right of the vertex (so x = 5).
For x = 3, this gives us:
- f(x) = 2(x – 4)2 + 7
- f(3) = 2(3 – 4)2 + 7
- f(3) = 2(-1)2 + 7
- f(3) = 2(1) + 7
- f(3) = 9
For x = 5, this gives us:
- f(x) = 2(5 – 4)2 + 7
- f(5) = 2(5 – 4)2 + 7
- f(5) = 2(1)2 + 7
- f(5) = 2(1) + 7
- f(5) = 9
Note that we get the same y-value, due to the symmetry of a parabola (since the values x = 3 and x = 5 are both the same distance from the vertex x = 4, but in different directions).
This means that the points (3, 9) and (5, 9) are both on the parabola.
Now, since a = 2, we know that a > 0 and the parabola is convex (concave up), meaning that it opens upward.
Finally, we draw the parabola that satisfies all of this information:
- Goes through points (3, 9) and (5, 9)
- Vertex at (4, 7)
- Concave up
You can see the graph of the quadratic function f(x) = 2(x – 4)2 + 7 below.
How To Graph A Quadratic Function In Factored Form
To graph a quadratic function in factored form, the basic steps are as follows:
- Find the zeros r and s from the factored form f(x) = a(x – r)(x – s).
- Find the x-coordinate of the vertex by taking the average of r and s: (r + s) / 2. Plug this into the function to find the y-coordinate of the vertex.
- If r and s are complex conjugates (or r = s, a double root), then find two x-values: the first is one unit left of the vertex, and the other is one unit right of the vertex. Use the function to find the corresponding y-values (they should be the same, due to symmetry of a parabola).
- Find the concavity by using the sign of the coefficient a.
Now we will try graphing a quadratic function give in factored form.
Example: Graphing A Quadratic Function In Factored Form
Consider the quadratic function
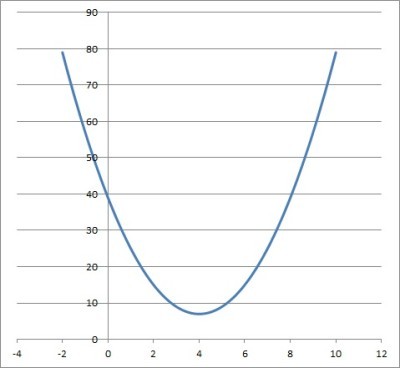
- f(x) = 3(x – 4)(x – 10)
First, we know that the zeros of the function are x = 4 and x = 10. So the points (4, 0) and (10, 0) are on the parabola.
Now we take the average of the two zeros: (4 + 10) / 2 = 7. Since x = 7 is the x-coordinate of the vertex, we can use the function to find the y-coordinate of the vertex:
- f(x) = 3(7 – 4)(7 – 10)
- f(3) = 3(7 – 4)(7 – 10)
- f(3) = 3(3)(-3)
- f(3) = -27
So the vertex is the point (7, -27).
Now, since a = 3, we know that a > 0 and the parabola is convex (concave up), meaning that it opens upward.
Finally, we draw the parabola that satisfies all of this information:
- Goes through points (4, 0) and (10, 0)
- Vertex at (7, -27)
- Concave up
You can see the graph of the quadratic function f(x) = 3(x – 4)(x – 10) below.
Conclusion
Now you know how to graph a quadratic and what to use to help you to draw the picture. You also know how the graph of a quadratic relates to the solutions of the corresponding quadratic equation.
You can learn how to complete the square for a quadratic equation in this article.
You might also want to read this article to learn about methods of solving quadratic equations.
You can learn about the focus of a parabola and what it means here.
You can learn how to find the domain and range of a parabola here.
I hope you found this article helpful. If so, please share it with someone who can use the information.
Don’t forget to subscribe to my YouTube channel & get updates on new math videos!
~Jonathon