
“Correlation does not imply causation.” This statement has been uttered so many times in stats classes, the statement has almost become a cliche! What does it really mean though?
In this article, we’ll learn about the correlation between two variables. We’ll also learn about causation – how can we determine if one event causes another?
Let’s get started!
Having math trouble?
Looking for a tutor?

What does correlation mean?
In the context of statistics, two variables are correlated if there is an association between the two variables.
If both variables are moving in the same direction, we have a positive correlation. If one variable increases as the other variable decreases, we have a negative correlation. In either case, the variables change together; we can also say that they covary.
When there is no relationship between the two variables, there is a zero correlation.
What is a correlation coefficient?
In statistics, we can actually use techniques to measure the strength of the correlation between two variables. The most common tool used in statistics classes to measure the strength of correlation is called the Pearson Correlation.
This coefficient is often used in linear regression and is represented by the variable r. It is a single number that represents the strength of the relationship between 2 variables. The value of r lies in the interval:
-1 <= r <= 1
Negative values of r indicate a negative relationship between the variables; that is the variables move in the opposite direction. An r value of -0.8 shows a strong negative relationship whereas an r value of -0.3 shows a weak negative relationship.
The closer the r value is to 0, the weaker the relationship.
Similarly, positive values of r indicate a positive relationship between the variables, so an r value of 0.9 is a very strong positive relationship. To compare the strength of the relationship between two variables, we can compare the absolute value of the r values.
If you want to play a game to guess the correlation coefficient of scatter plots, try this. (Warning: this game is way more fun than it should be!)
Geogebra Guess the Correlation Coefficient
We’ve learned about correlation. It seems as though it would be easy to draw conclusions from correlated variables.
Often, our conclusions may be incorrect. Consider the relatively famous example of the relationship between ice cream sales and shark attacks. It turns out that the two variables are closely related.
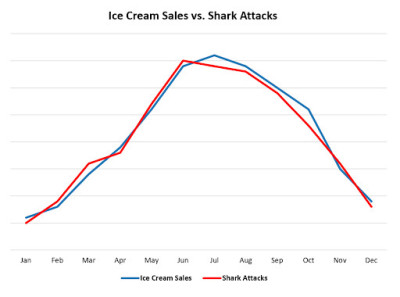
Source: statology.org
Notice how closely the two graphs align! The two variables of ice cream sales and shark attacks have a strong correlation.
But does this mean that eating ice cream makes you more likely to get attacked by a shark? Probably not! Also, I hope not because I eat a lot of ice cream!
So, what is happening here? Well, there may be another variable at work. People tend to eat more ice cream during the warmer months and they’re more likely to swim in the ocean in the warmer months, hence the similarity in the two graphs.
Sometimes, two variables may appear to be related but perhaps the relationship is by random chance or by another variable.
Important note: correlation can verify the existence of a relationship between two variables but does not confirm that one variable causes the other.
Having math trouble?
Looking for a tutor?
Why doesn’t correlation imply causation?
There are a few reasons why correlation does not mean that one variable caused the other.
- The presence of a third variable. There may be a third variable that affects both variables, making it seem as though there is a causal relationship when there isn’t. For example, in the ice cream sales and shark attack example, the third variable, warmer temperatures, causes both ice cream sales to go up and shark attacks to increase. The third variable acts on each of the variables separately.
- The apparent relationship between the two variables occurred by random chance, not because one variable caused the other. A famous example comes from the NFL. The outcome of the most recent Washington Commanders (formerly the Washington Redskins) home game prior to a US presidential election correlated strongly. When Washington won, the incumbent US president won; when Washington lost, the candidate from the opposing party won. This relationship was true from 1940 to 2000! (Source: wikipedia.org)
- There may be a sampling error in the study. If a study isn’t properly randomized, there can appear to be a correlation between two variables. This could be true of the sample but not of the overall population.
What is causation?
Causation indicates that one event directly caused the other event. There is a cause and effect relationship between the two events. (Source: abs.gov)
Sometimes it is easy to discern the difference between correlation; other times, not so much. In theory, it seems as though it should be a straightforward task, determining causation but in practice this can be challenging. Statisticians have developed methods that help understand whether two variables are correlated or whether one causes the other.
If you’re familiar with medical studies, you may be aware of the idea of randomizing samples and establishing control groups. In a controlled study, participants are divided into two groups. Typically, one group receives the treatment, like a new medicine, and the other group receives a placebo.
If the treatment group shows a noticeably different outcome compared with the control group, there is a possible cause and effect relationship; that is, the new medicine may help alleviate the condition being treated!

Strategies to help attain causation
It turns out there are 3 criteria that are necessary for establishing cause and effect between 2 variables. If we want to show that X causes Y, the following 3 conditions must be met:
3 criteria for establishing causation
- Temporal sequencing – the cause X must precede the effect Y. This may seem like common sense, but it is important to know which event happened first.
- Non-spurious relationship – The relationship between the 2 variables is not due to chance alone. (Our NFL example from above demonstrates a relationship that was due to chance.)
- Eliminate alternate causes – there is no other underlying 3rd variable that accounts for the relationship between the X and Y variables. The ice cream sales/shark attack example is an alternate cause that accounts for the relationship between the two variables.
source: umks.edu
Now that we’ve learned a bit more about correlation and causation, you’ll have better tools analyzing data going forward. So, the next time you’re having a statistics related conversation with your peers, impress them with your knowledge of correlation and causation!
You can learn how to find correlation coefficients in Excel here.
I hope you found this article helpful. If so, please share it with someone who can use the information.
Don’t forget to subscribe to our YouTube channel & get updates on new math videos!
About the author:
Jean-Marie Gard is an independent math teacher and tutor based in Massachusetts. You can get in touch with Jean-Marie at https://testpreptoday.com/.