
Venn diagrams are used throughout math, science, and other disciplines to express ideas in a visual way. Once you know what they are and why to use them, you can figure out how to solve them.
So, what is a Venn diagram? A Venn diagram is a picture that uses shapes (usually circles) to show the relationship between sets. Each set is represented by a circle, and we can see the overlap between sets (if there is an overlap). We use Venn diagrams for set theory, probability, logic, computer science, & other subjects.
Of course, we can also study the complement of sets (and their unions or intersections) using Venn diagrams.
In this article, we’ll talk about Venn diagrams, when to use them, and how to solve them. We’ll also answer some common questions about Venn diagrams.
Let’s get started.
What Is A Venn Diagram?
A Venn diagram is a picture that shows the relationship between two or more sets (groups of objects). A Venn diagram shows the overlap between sets (if there is any).
A circle is the most common shape for each set in a Venn diagram. We can draw individual elements (items) of each set in a Venn diagram.
What Is A Venn Diagram Used For? (When To Use Venn Diagrams)
A Venn diagram is used in lots of different ways in math and science, including:
- Set Theory – for example, showing the relationship between imaginary numbers, real numbers, and complex numbers.
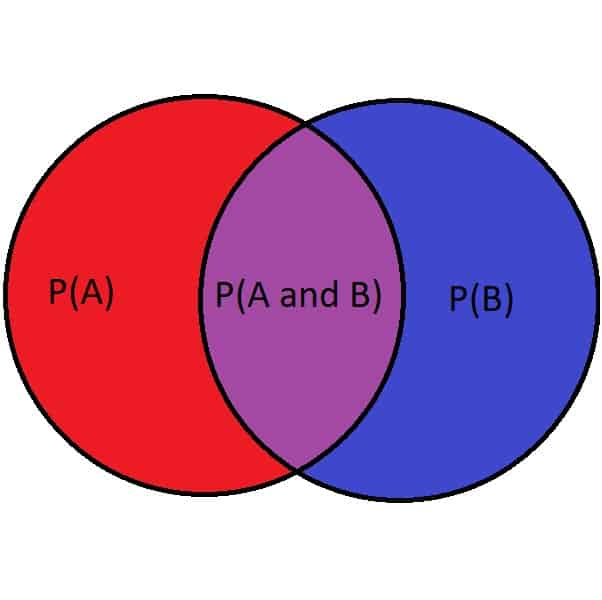
- Probability – for example, showing the probability that a person belongs to one group, or another (or both groups, or neither group).
- Logic – for example, showing the overlap between logical statements (Fido is a dog, Fido is a mammal, Fido is an animal, etc.)
- Computer Science – for example, showing the overlap between items in databases.
A Venn diagram is used to show the union, intersection, and complement of sets in a visual way.
Where Is The Union On A Venn Diagram?
The union on a Venn diagram is the inside of every set taken together:
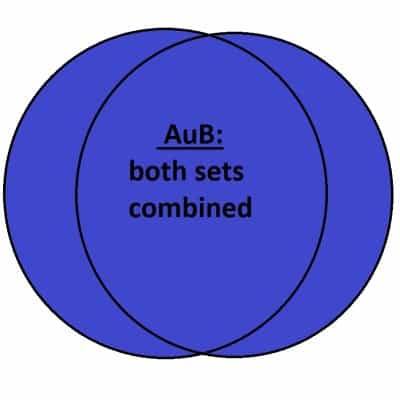
- If there are 2 sets A and B in the Venn diagram, then the union is AuB, and it includes everything inside set A, everything inside set B, and everything inside their overlap.
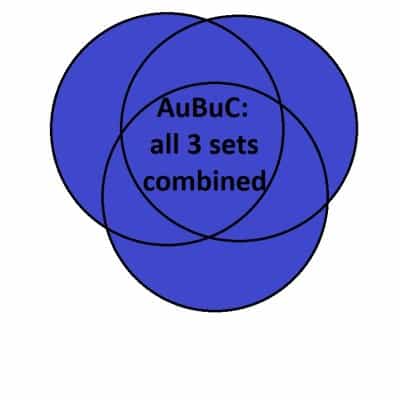
- If there are 3 sets A, B, and C in the Venn diagram, then the union is AuBuC, and it includes everything inside set A, everything inside set B, everything inside set C, and everything inside any overlap (A & B, A & C, B & C, or A & B & C).
- and so on for 4, 5, 6, … sets.
You can see the union for a 2-set Venn diagram illustrated below.
You can see the union for a 3-set Venn diagram illustrated below.
Where Is The Intersection On A Venn Diagram?
The intersection on a Venn diagram is the place where all sets in the diagram overlap (if any such place exists):
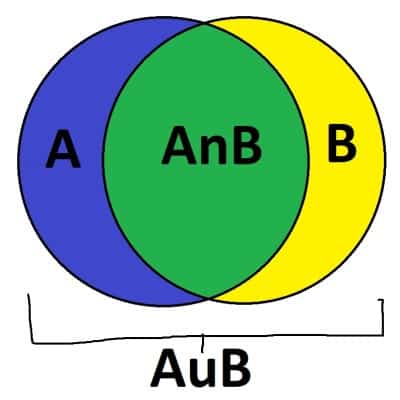
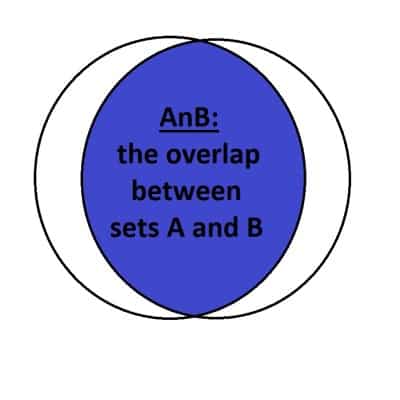
- If there are 2 sets A and B in the Venn diagram, then the intersection is AnB, and it includes everything in the overlap between sets A and B.
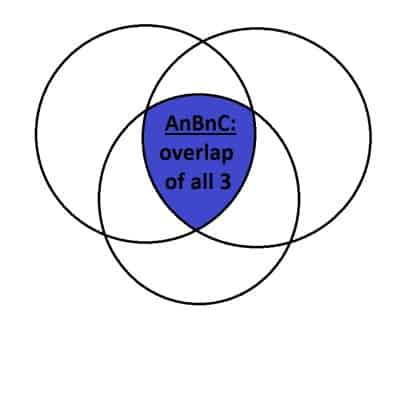
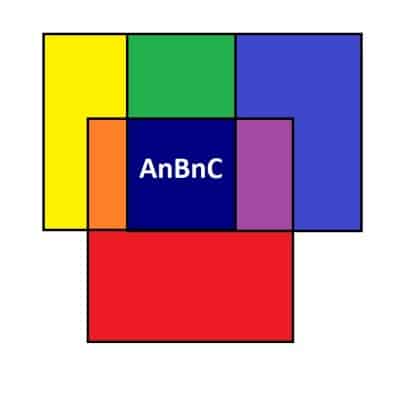
- If there are 3 sets A, B, and C in the Venn diagram, then the intersection is AnBnC, and it includes everything in the overlap between sets A, B, and C.
- and so on for 4, 5, 6, … sets.
You can see the intersection for various Venn diagrams illustrated below.
You can see the intersection for a 2-set Venn diagram illustrated below.
You can see the intersection for a 3-set Venn diagram illustrated below.
Where Is the Complement On A Venn Diagram?
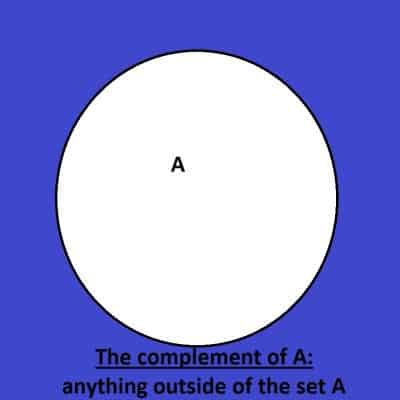
The complement on a Venn diagram is the place outside of a given set (that is, everything not in the set).
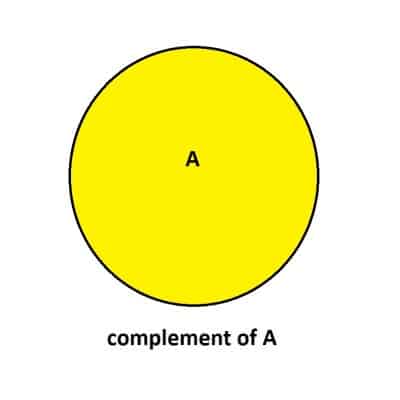
For a set A, the complement is denoted by AC. You can see the set A and its complement illustrated below.
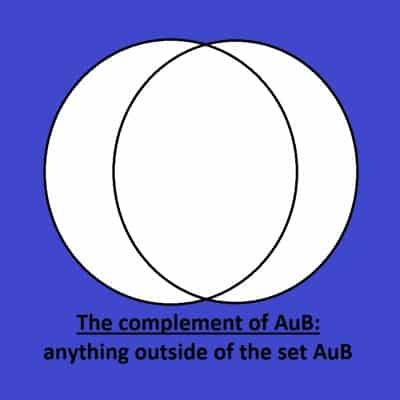
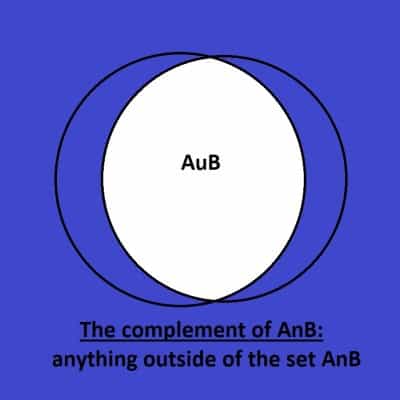
We can also take the complement of AuB or AnB by using De Morgan’s Laws:
- (AuB)C = ACnBC
- (AnB)C = ACuBC
You can see the complement of AuB below:
You can also see the complement of AnB below:
Can A Venn Diagram Not Overlap?
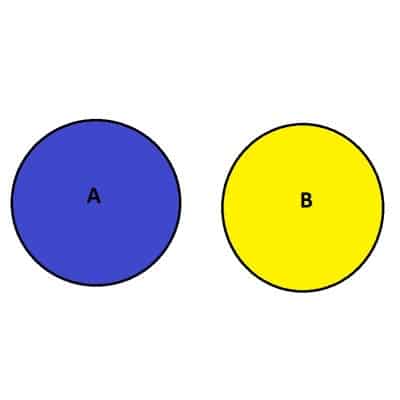
In some cases, the two sets in a Venn diagram will have no items in common. In that case, there is no overlap between the circles in the diagram.
This suggests that the set AnB (the intersection of A and B) is empty. In the case of a probability problem, no overlap between sets A and B in a Venn diagram means that P(AnB) = 0.
It also means that we have a simplified formula for P(AuB):
- P(AuB) = P(A) + P(B) – P(AnB) [the usual formula for the probability of AuB]
- P(AuB) = P(A) + P(B) – 0 [since P(AnB) = 0 when there is no overlap between A and B]
- P(AuB) = P(A) + P(B) [simplified formula for P(AuB)]
A lack of overlap can happen when there are 2 sets in the Venn diagram, as shown below.
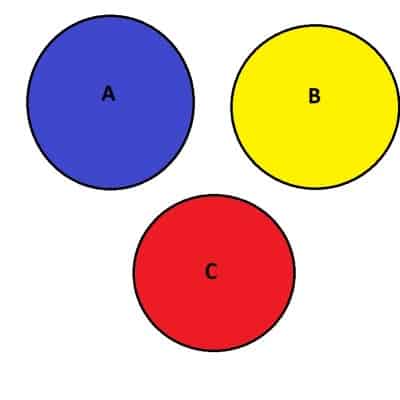
A lack of overlap can also happen when there are 3 sets in the Venn diagram, as shown below.
Can A Venn Diagram Have One Circle?
A Venn diagram can have one circle. In this case, we can only illustrate a set A and its complement, AC. In other words, we can decide if an item is in the set A or outside of the set A.
Can A Venn Diagram Have 3 Circles?
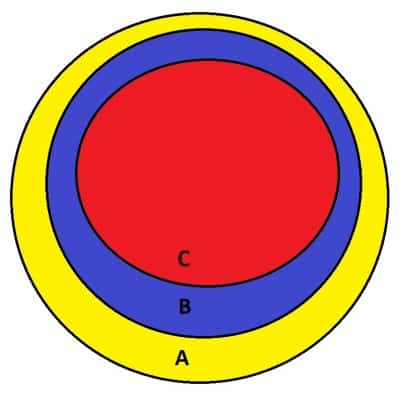
A Venn diagram can have 3 circles. In this case, there are 3 sets A, B, and C to be graphed.
There may be no overlap at all between the 3 sets, or there may be some overlap, or they may be “nested” in some way (for example, if A contains B, and B contains C).
Can A Venn Diagram Have 4 Circles?
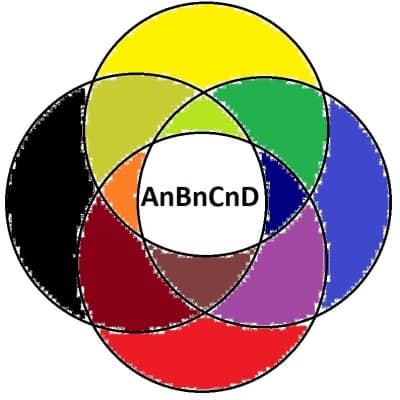
A Venn diagram can have 4 circles. In this case, there are 4 sets A, B, C, and D to be graphed. It gets a little tricky to draw the diagram at this stage!
There may be no overlap at all between the 4 sets, or there may be some overlap, or they may be “nested” in some way (for example, if A contains B, B contains C, and C contains D).
Can Venn Diagrams Be Square?
Venn diagrams can use squares for the sets (or any shape you like). It is customary to use a circle for each set in the diagram but you can still express the same ideas with squares and other shapes.
How To Solve A Venn Diagram
To solve a Venn diagram, we fill in every area on the graph with a number (or with the items) or a probability.
Example 1: How To Solve A Venn Diagram With Two Sets
Let’s say we have the Venn diagram below.
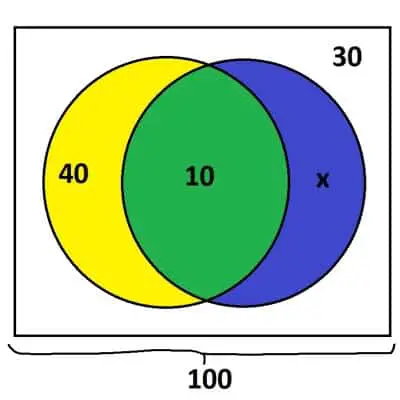
The large rectangle contains 100 items in total. There are 30 items outside of the circles, 40 in the yellow part of the left circle, x in the blue part of the right circle, and 10 in the green overlap.
This gives us the equation:
- 30 + 40 + x + 10 = 100
- x + 80 = 100
- x = 20
So, we have x = 20. This means that the left circle has 40 + 10 = 50 items, while the right circle has 20 + 10 = 30 items total.
Example 2: How To Solve A Venn Diagram With Three Sets
Let’s say we have the Venn diagram below.
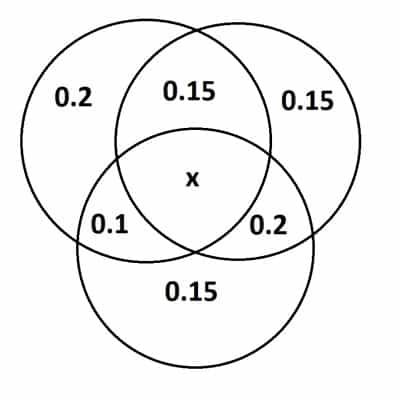
Since the total probability is 1, we can write the equation:
- x + 0.2 + 0.15 + 0.15 + 0.1 + 0.2 + 0.15 = 1
- x + 0.95 = 1
- x = 0.05
So, x = 0.05, and the probability of an overlap between all three circles is 5% (0.05 as a decimal).
Conclusion
Now you know what a Venn diagram is and what they are used for. You also know the answers to some common questions about Venn diagrams and how to solve them.
I hope you found this article helpful. If so, please share it with someone who can use the information.

Don’t forget to subscribe to our YouTube channel & get updates on new math videos!