
What is a sinusoidal function?
If you’ve taken precalculus or even geometry, you’re likely familiar with sine and cosine functions. Does SOH CAH TOA ring any bells? Once trig functions have been introduced, eventually you’ll learn about sinusoidal functions. Sinusoidal functions are more generalized sine or cosine functions.
| The General Form for Sinusoidal Functions y = Acos(B(x-C))+D y = Asin(B(x-C))+D where: |A| = the amplitude of the function; the amplitude of a function is the distance from the midline to a maximum or a minimum value of the function. The midline is the horizontal line that is midway between the maximum and minimum values. The function oscillates above and below the midline. B = the number of cycles from 0 to 2π; the period of the function is given by 2π/B. C = the phase shift (horizontal shift) of the function. D = the vertical shift of the function; the equation y=D is the midline of the function. |
To graph sinusoidal functions, it’s a great idea to be very familiar with the parent functions y=sin x, and y=cos x. For each of these parent functions, we’ll identify 5 key points that will help us graph more complicated sinusoidal functions.
Here is the parent function y=sin x, with 5 key points labeled V – Z. This graph is one complete cycle of the sine function. We could continue this pattern indefinitely on either side of our graph. Since the sine function is periodic, this wave will just repeat over and over.
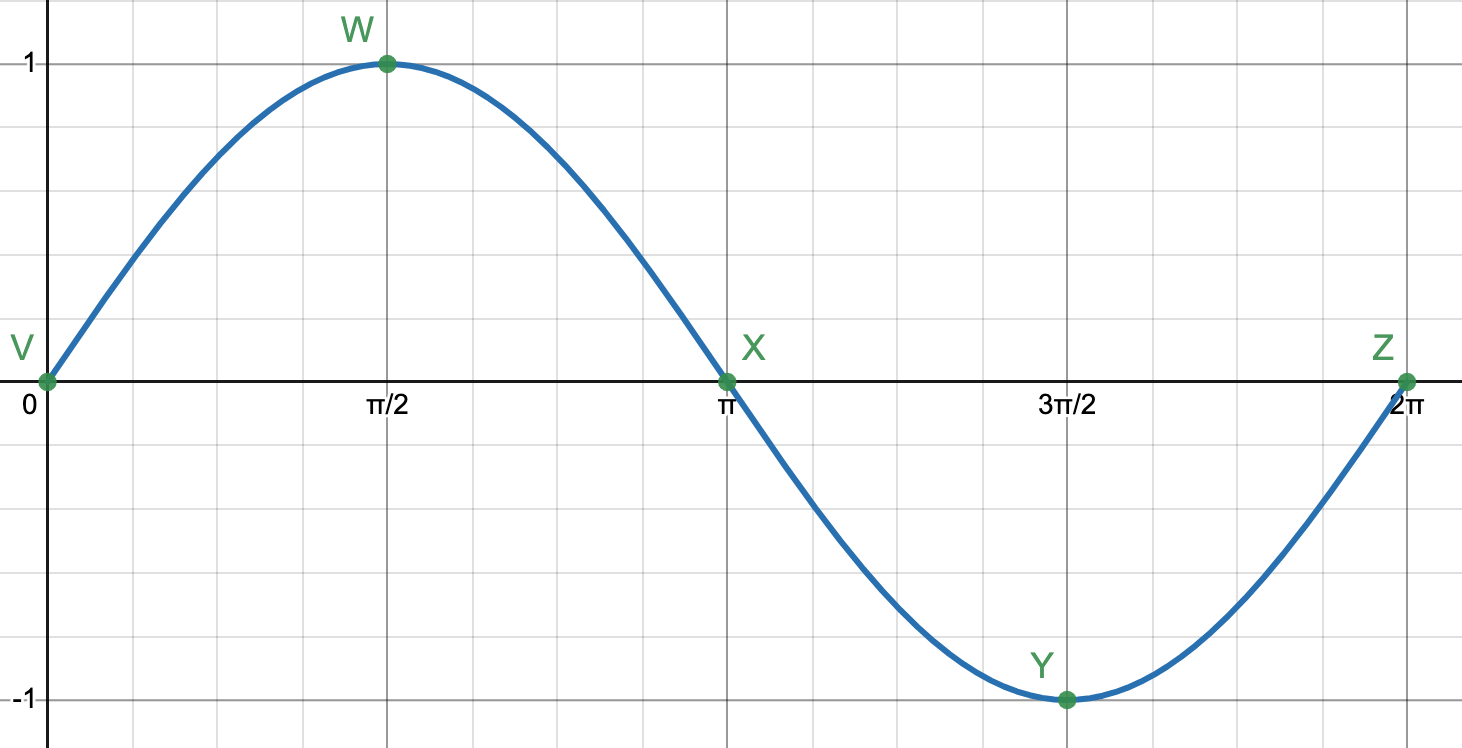
There are a few things to notice here. The zeros for this function occur at the beginning, middle, and end of the wave (at points V, X, and Z.) The zeros of the parent function correspond to midline points on sinusoidal graphs.
Key points B and D occur at the maximum and minimum values, respectively. We will make excellent use of the 5 key points as we go about the business of graphing sine and cosine curves.
For the parent function y=sin x, the amplitude A is 1, B is 1 so the period is 2, C is 0 since there’s no phase shift, and D is 0 since there isn’t a vertical shift.
Example
Graph the function
y=3sin(2(x+(π/2))) – 1
Solution
To sketch this sinusoidal graph, determine A, B, C, and D:
- A: the amplitude is 3.
- B: 2. Now, we can use the value of B to find the period. The period is 2π/2=π.
- C: the phase shift is -π/2, which means left π/2 units. The phase shift is always the opposite sign of the constant.
- D: the vertical shift is -1, which means down 1 unit. The midline is y=-1.
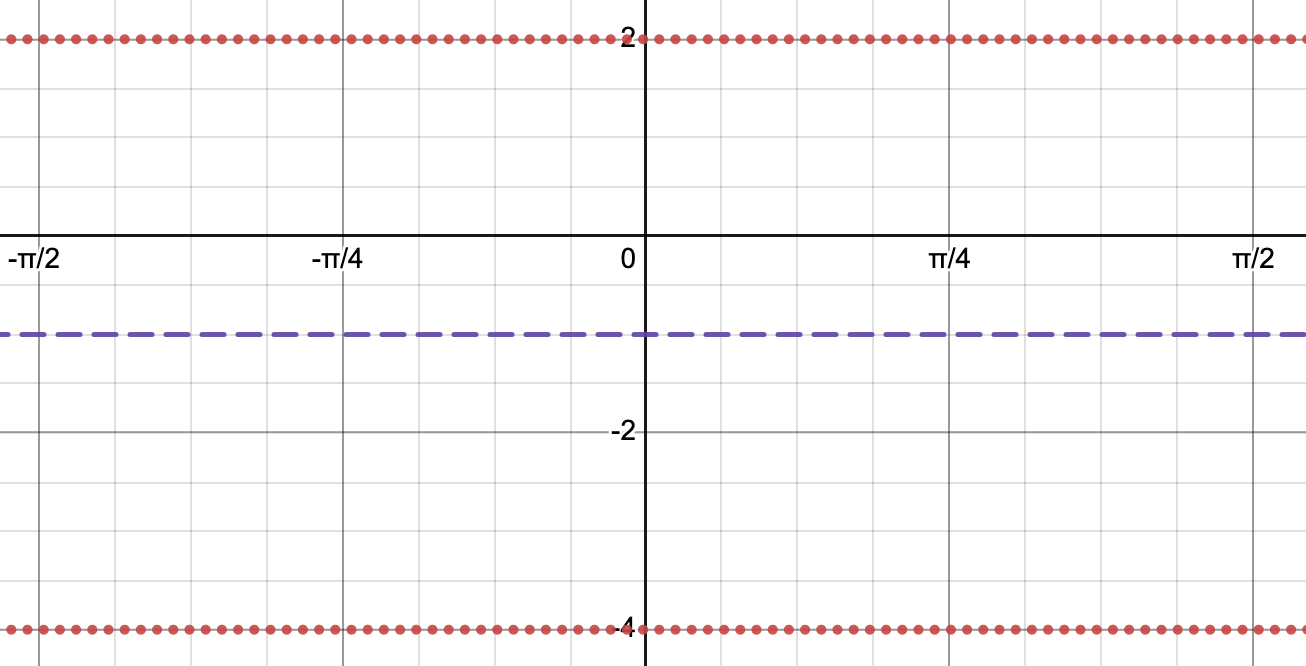
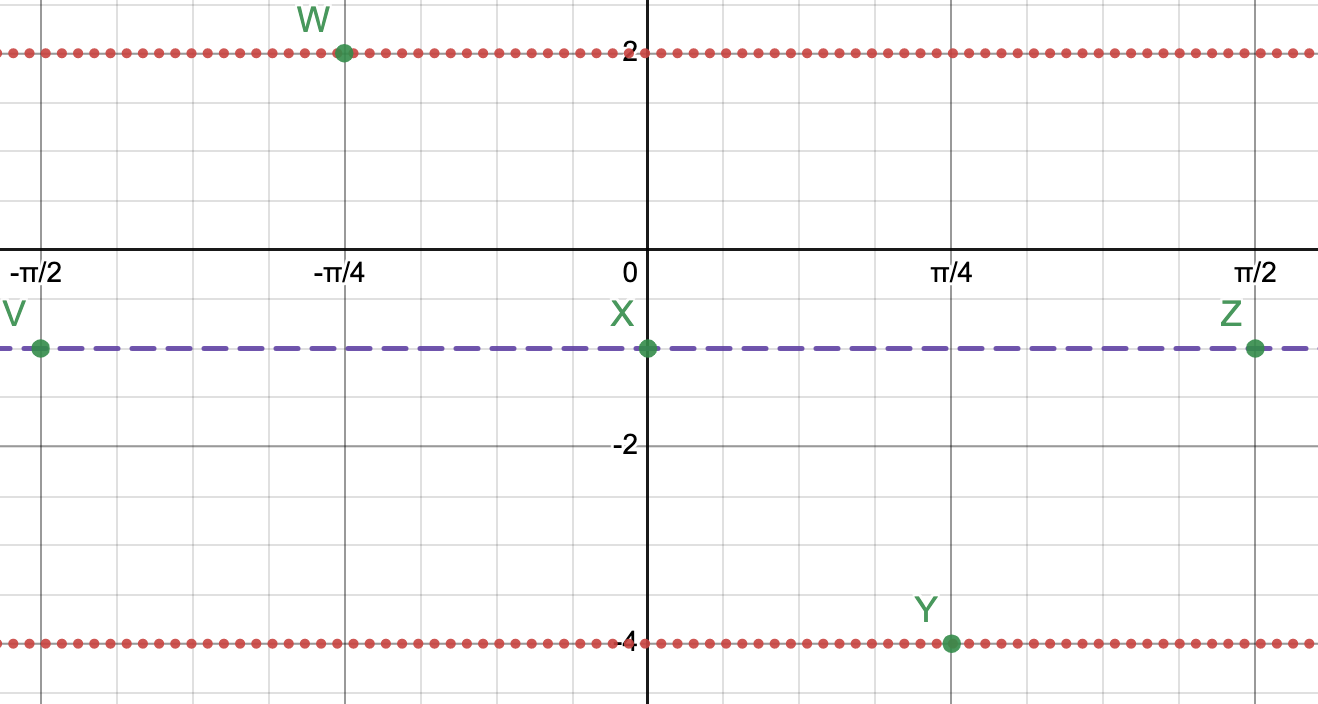
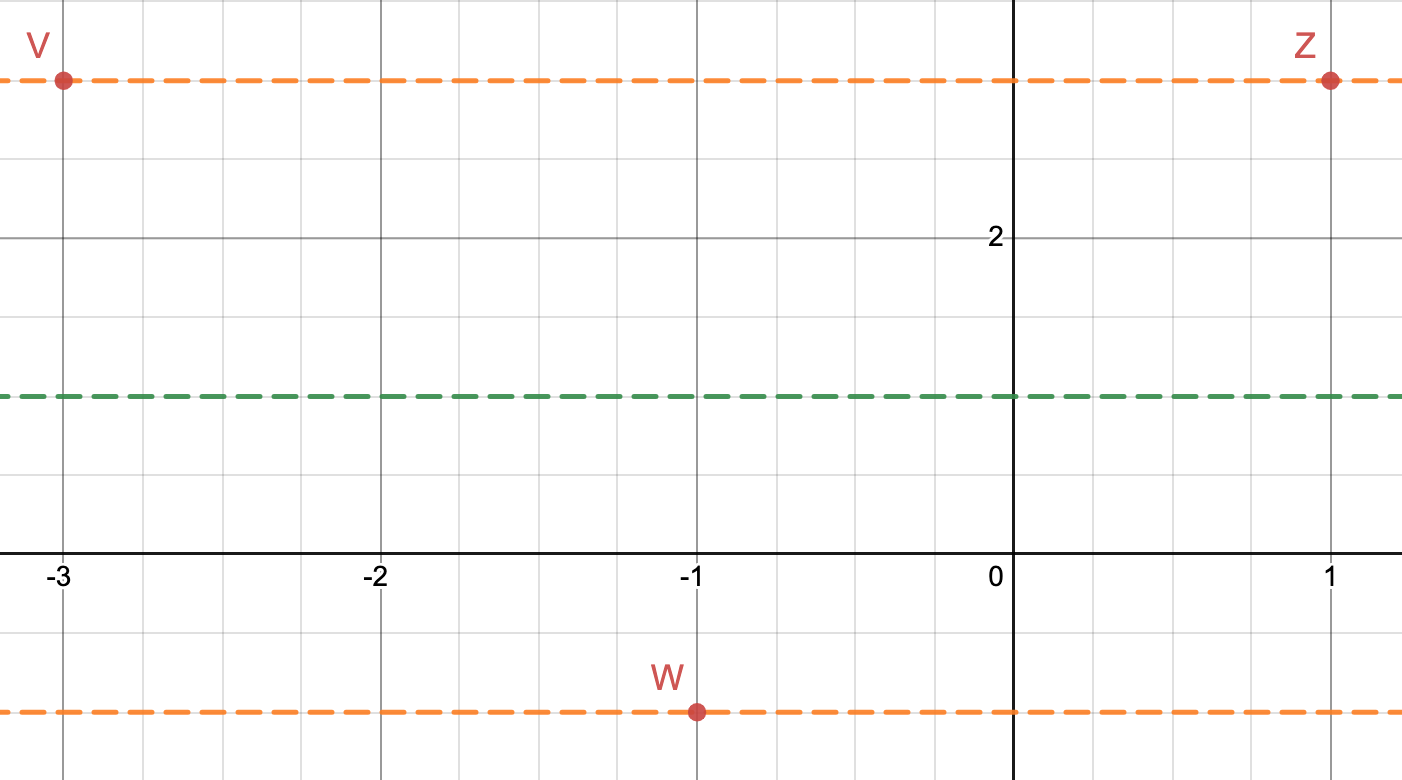
Use the vertical shift to graph the midline, then use the amplitude to determine where the maximum and minimum values will go. Since the midline is y=-1 and the amplitude is 3, the maximum values will be on the line y=-1+3 = 2 and the minimum values will be on the line y=-1-3 = -4. Our sketch now looks like this:
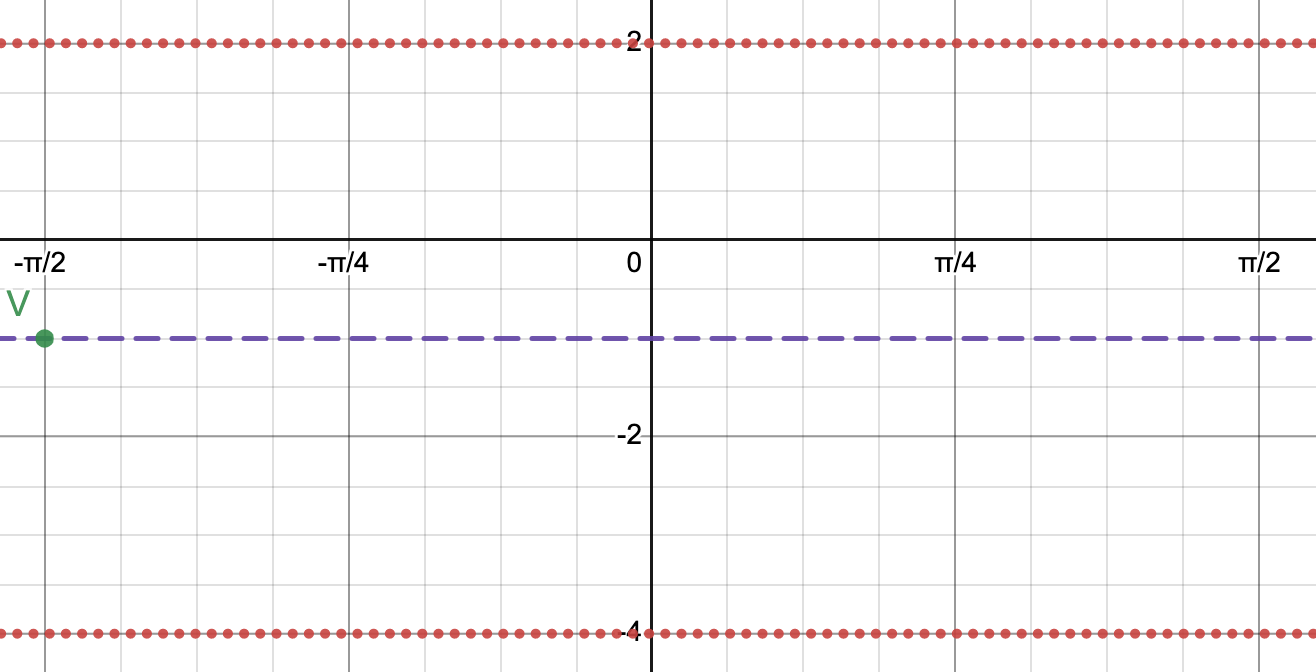
Next, we can use the phase shift to determine the first key point. Keep in mind, that for the parent function y=sin x, the first point in one cycle is on the midline. Graph this point, labeled V below.
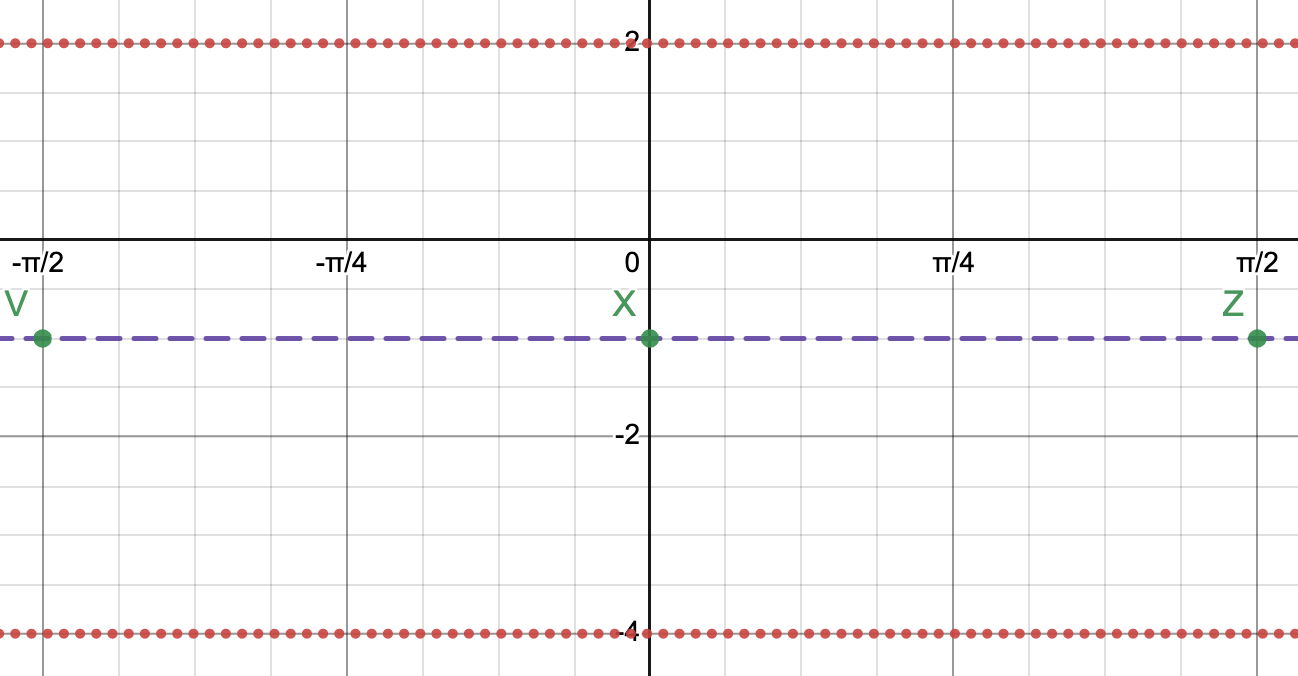
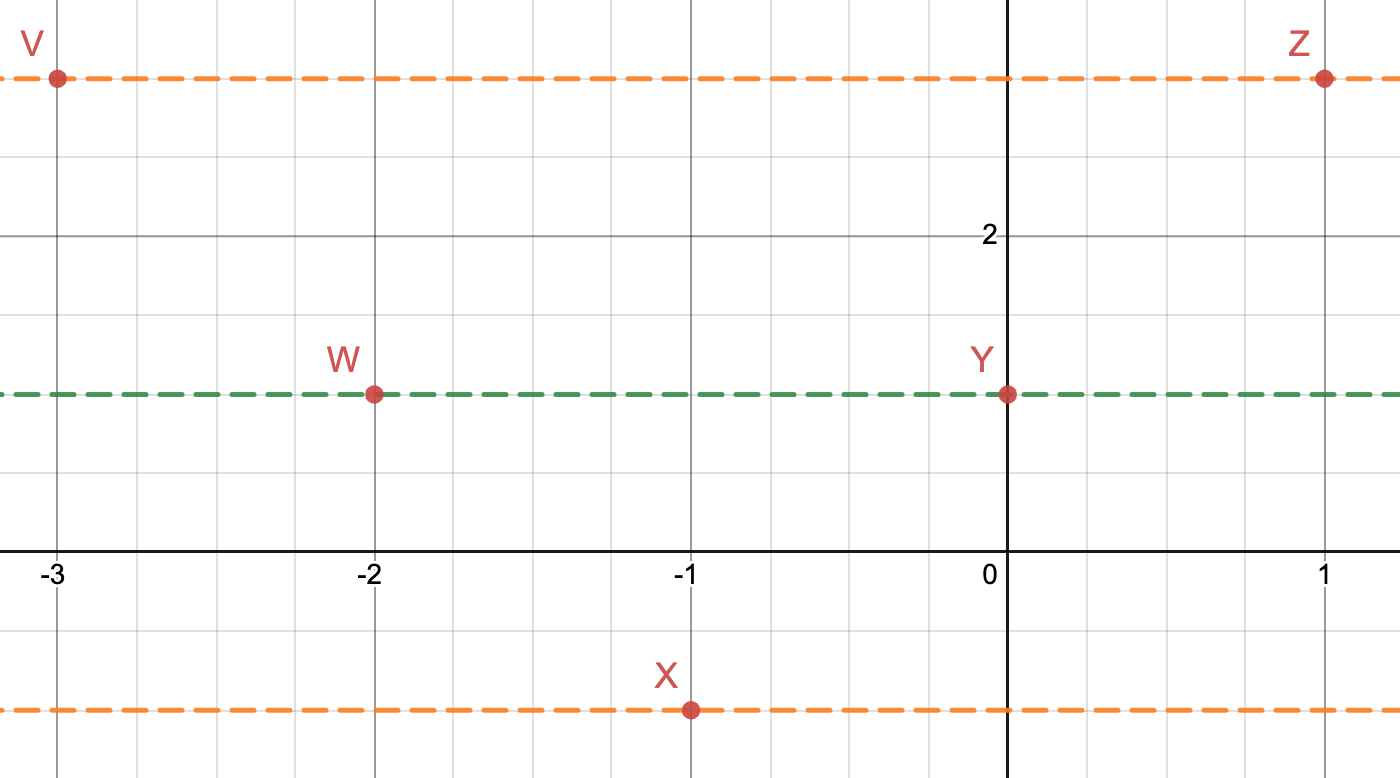
Since the period is , we can find the last value for one complete cycle -π/2+π = π/2. This point Z will also go on the midline. Halfway between the first and last point occurs another midline point X.
Plot the maximum and minimum values. The maximum occurs halfway between V and X. The minimum occurs halfway between X and Z. Label these points W and Y, respectively.
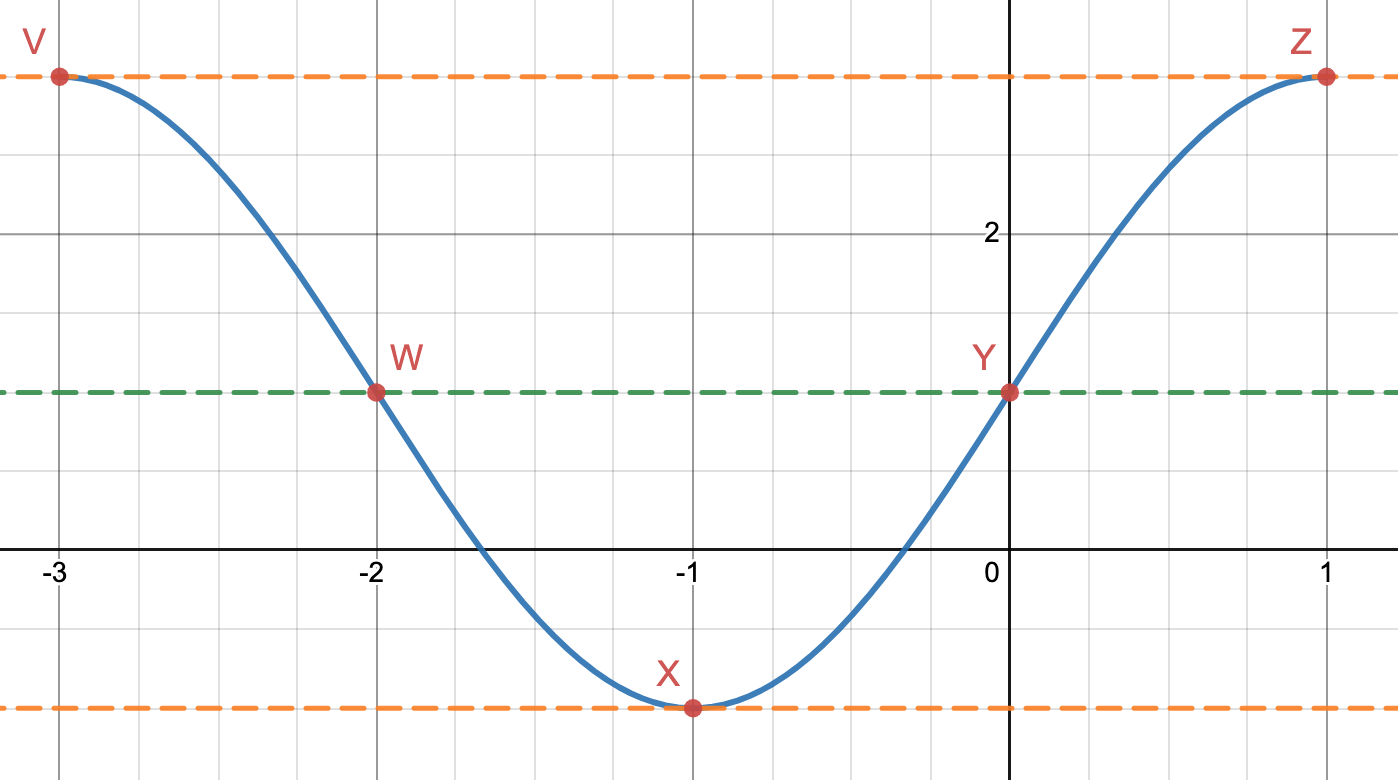
Now, all that’s left to do is sketch the curve!
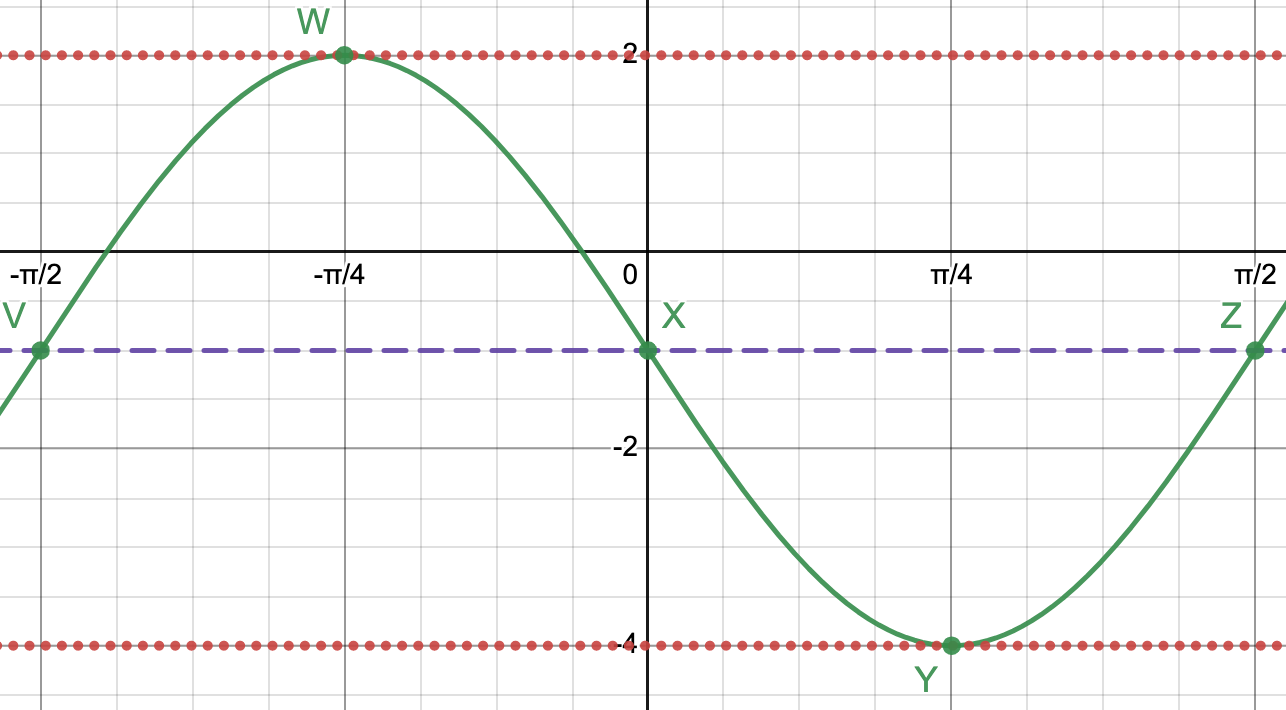
Voila!
Let’s consider the parent function y=cos x. One cycle of the cosine function looks like this:
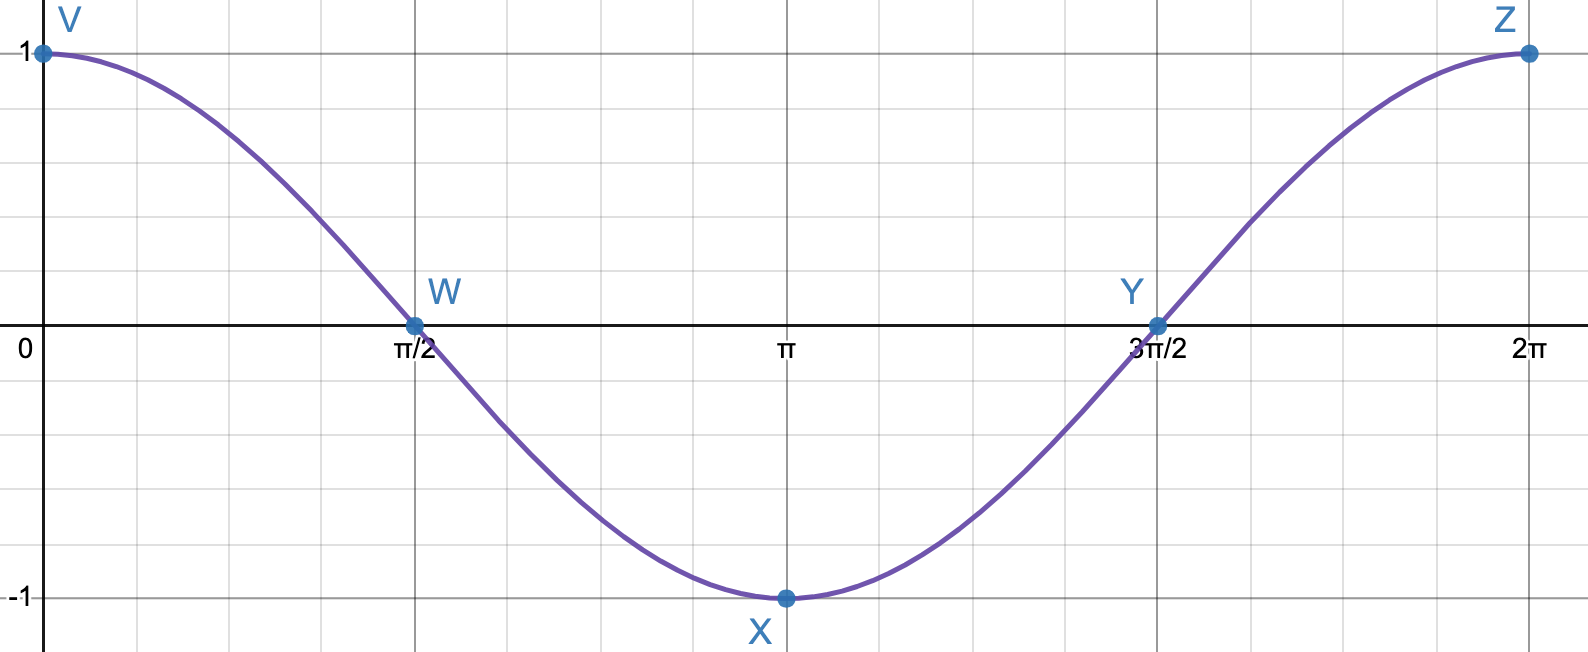
Similar to the sine function, there are 5 key points, labeled V to Z. Notice, one cycle of the cosine function starts at a maximum and ends on a maximum.
Halfway through the cycle is a minimum. Then, halfway between V and X is a zero and halfway between X and Z is another zero.
Example
Graph the function:
y=2cos((π/2)(x+3)) + 1
Solution
As before, we’ll start by identifying the values of A, B, C, and D:
- A: the amplitude is 2.
- B: π/2. Use the value of B to find the period. The period is 2π/(π/2) = 4.
- C: the phase shift is -3.
- D: the vertical shift is 1. The midline is y=1.
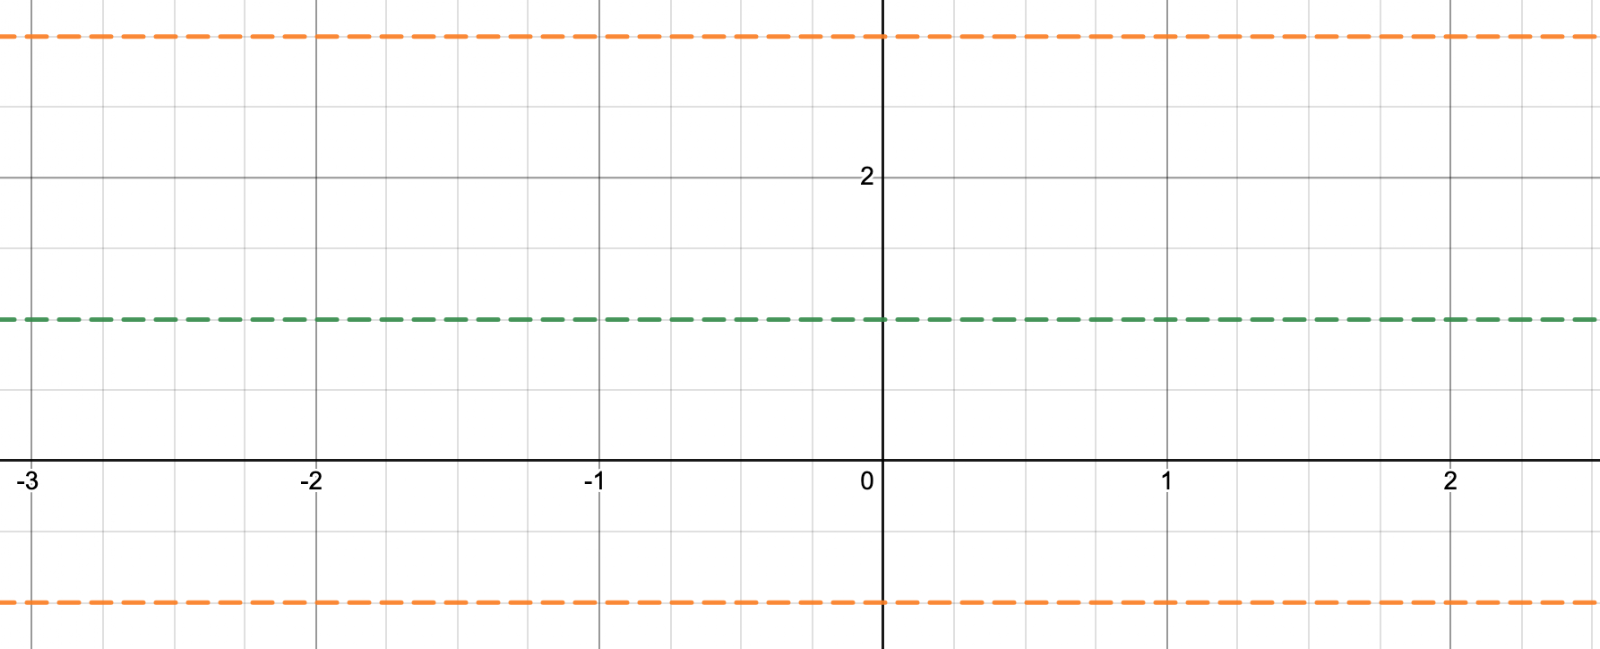
Start by graphing the midline and the maximum and minimum lines. Using the amplitude, the maximums occur on the line y=1+2=3 and the minimums occur on the line y=1-2=-1.
Let’s find the first key point. Since the phase shift is -3 and the parent function starts at a maximum, the first point is (-3, 3).
Add the period to the x-coordinate of the first point to get the x-coordinate of the last point. The x-coordinate of the last point is -3+4 = 1.
The last point is also a maximum, so that point is (1, 3). For the parent function, halfway between the first and last point is a minimum. For this graph, the minimum occurs at (-3+1)/2 = -1. The minimum occurs at (1, -1). Plot these three points.
Using patterns we observed from the parent function, we know that the zeros of the parent function occur halfway between successive maximum and minimum points on the x-axis. These points on a more generalized sinuosoidal wave occur on the midline.
For our graph, this means that we can plot points (-2, 1) and (0, 1). Our graph should look like this:
Finally, connect the 5 key points to graph one cycle of our function!
If you want to graph more than one cycle, you can just extend the graph in either direction and continue plotting key points.
Suppose instead, we want to graph the function y=-2cos((π/2)(x+3)) + 1. The only thing that has changed is the negative sign in front of the function.
How will this graph differ from our previous graph? It’s helpful to remember function transformations. For a function f(x), the graph of –f(x) is a reflection of f(x) over the x-axis.
That seems simple enough! The graph will look like this:
Example
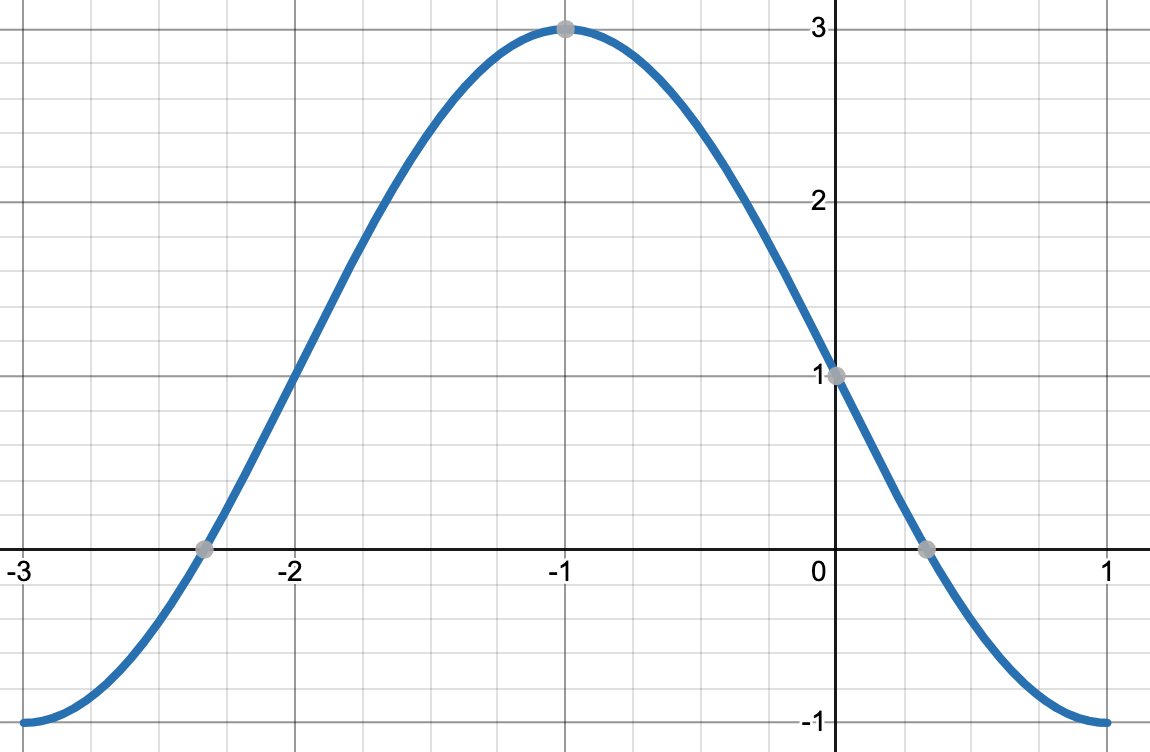
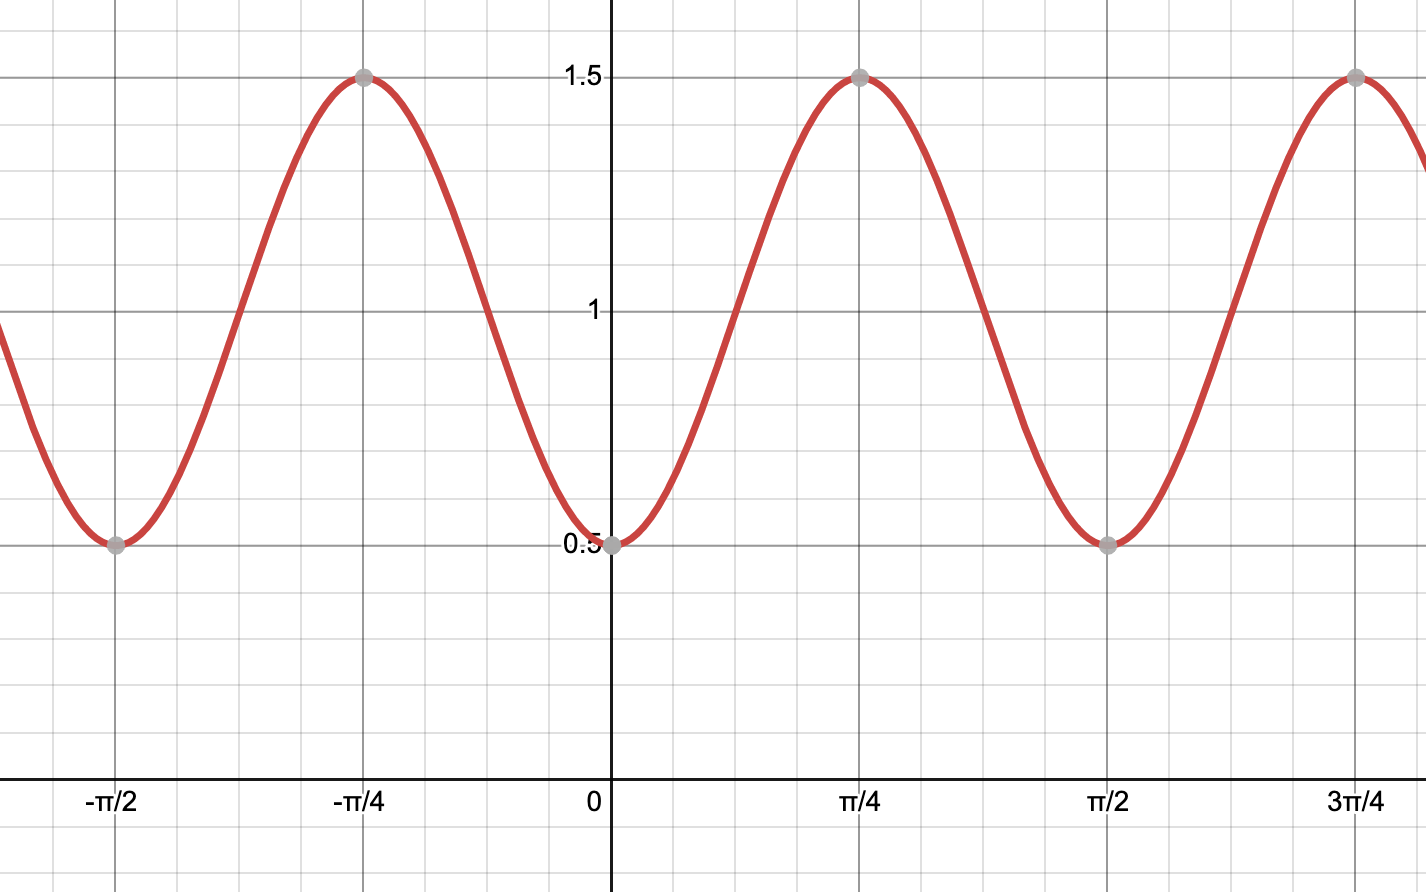
For the graph pictured below, write two equations to represent the graph, one equation using the sine function and the other equation using the cosine function.
Solution
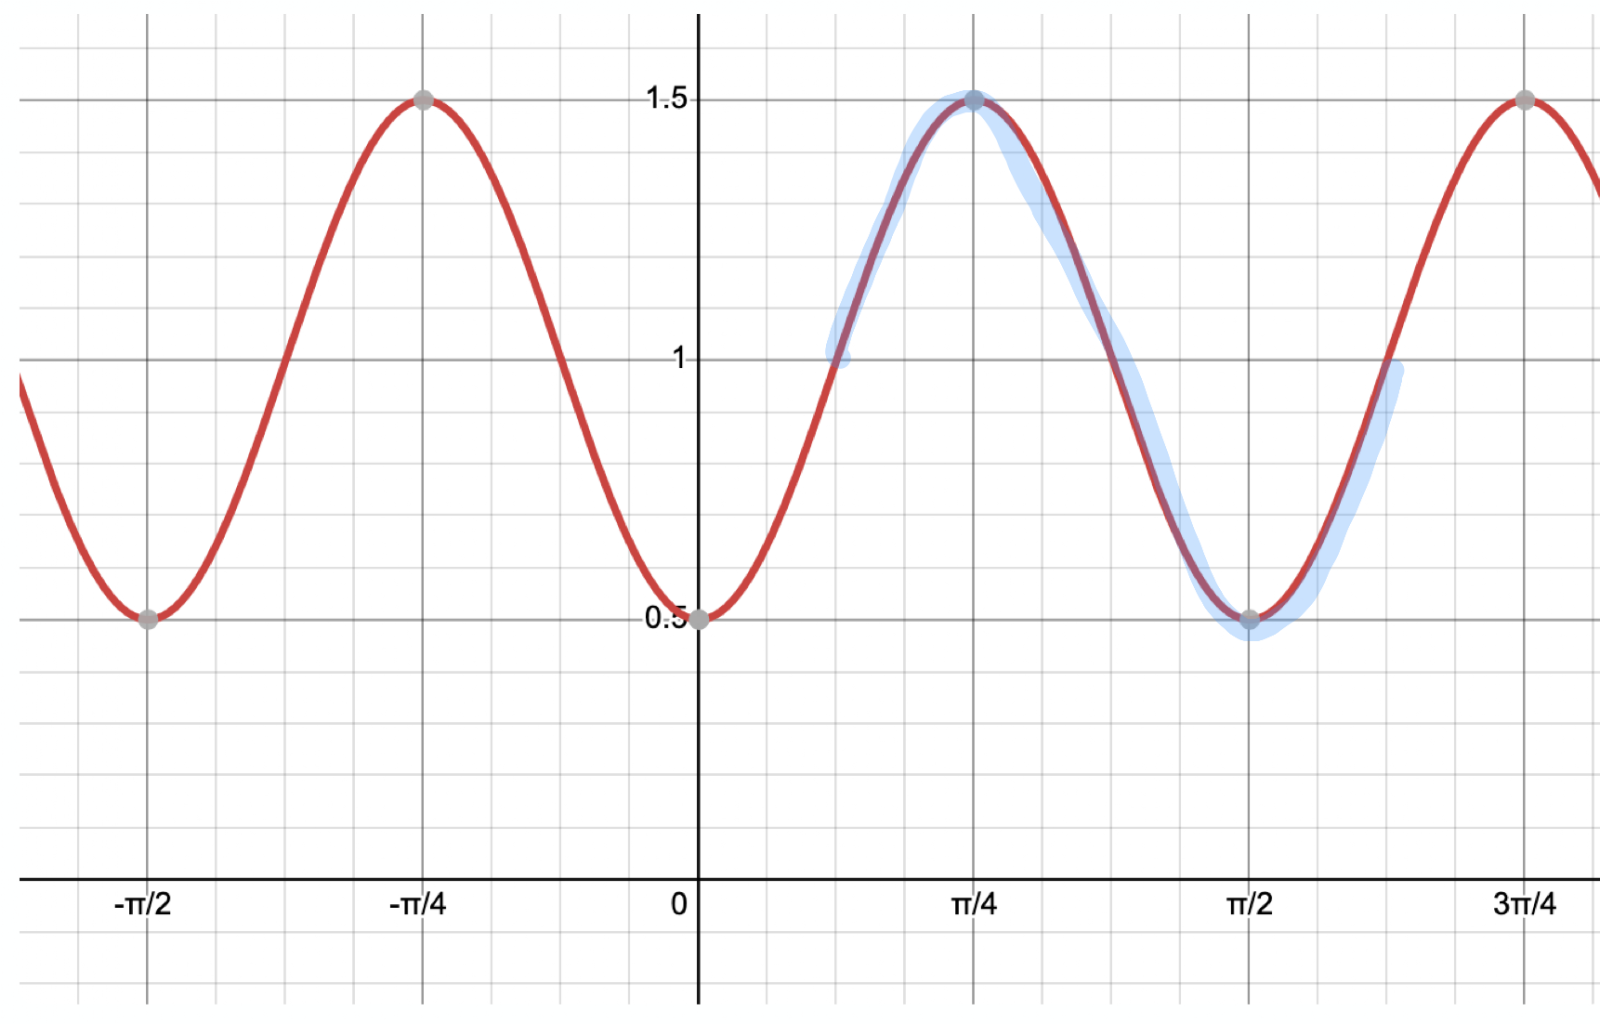
Let’s start by writing a sine function. There are lots of different sine equations that we can write, depending on our starting point. Approach this by finding one cycle of the sine curve – see the sine wave I selected below in blue.
Now, determine our A, B, C, and D values.
- A – The amplitude is the distance from the midline to a maximum value or a minimum value. Our midline in this case is y=1 and the maximum value is 1.5, so the amplitude is 1.5 – 1 = 0.5.
- B – Find the period and divide 2 by the period to obtain B. To find the period, we need to figure out the horizontal distance of one sine wave. The sine wave we selected starts at x=π/8 and ends at x=5π/8, so the period is 5π/8 – π/8= π/2. Therefore, B=2π/(π/2) =4.
- C – The cycle we selected starts at x=π/8, so our phase shift is π/8.
- D – We already determined that the midline is y=1, so our vertical shift is up 1 unit.
Putting this all together, we obtain the equation y=0.5sin(4(x-(π/8))+1. If you graph this in Desmos or a graphing calculator, you’ll see that we obtain the same graph as above!
Now, let’s write the equation of a cosine function that will match our graph. Let’s think about this a bit. The amplitude should be the same as the sine function.
The period should be the same. And the midline should be the same. So, our values of A, B, and D should all match our sine function. The only thing that will change is the phase shift.
Let’s identify one complete cosine wave on the graph:
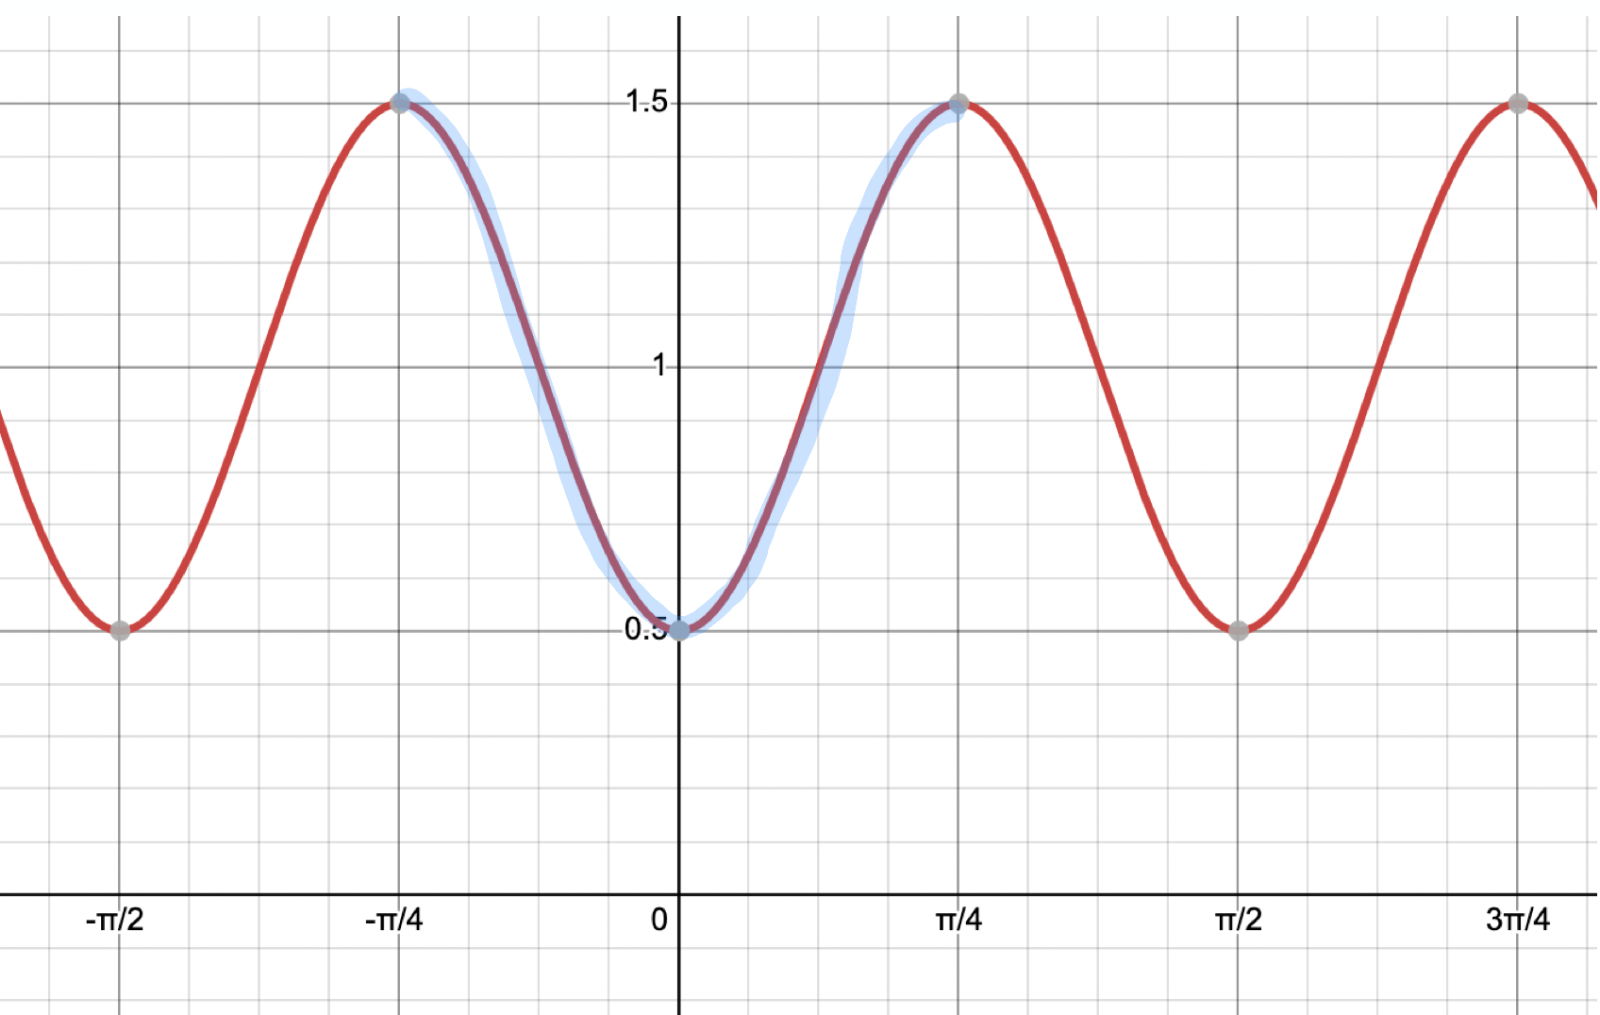
For the blue cosine wave selected, the starting point is -π/4, so the phase shift C is -π/4.
Writing the cosine equation, we obtain y=0.5cos(4(x+(π/4))+1. There we have it!

Example
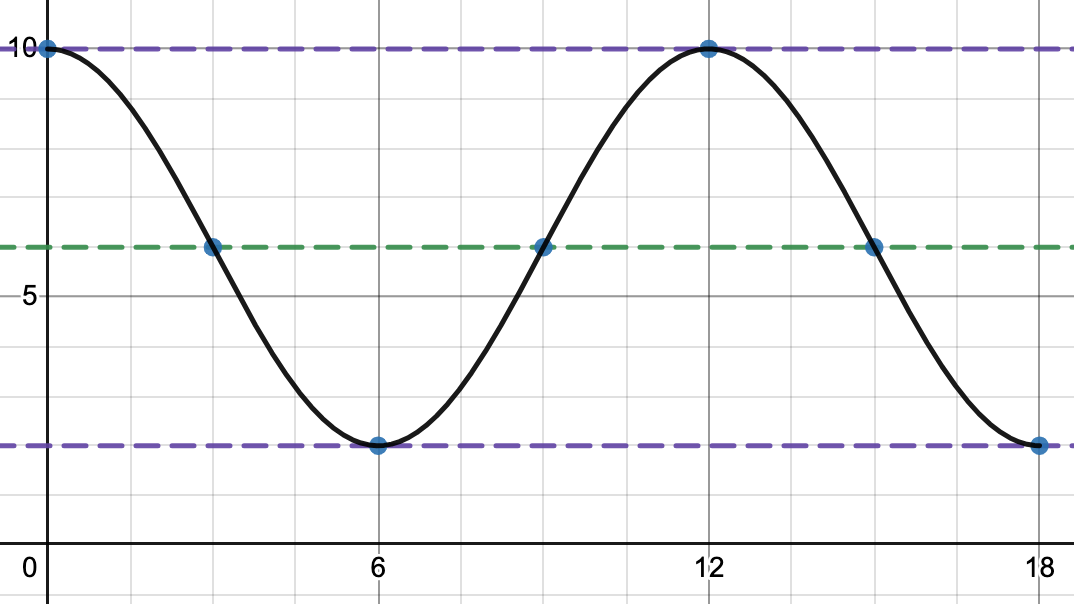
At Ocean Drive Beach on a certain day, high tide occurs at midnight and noon and low tide occurs at 6 am and 6 pm. At high tide, the waves generally reach 10 ft and at low tide, the waves reach 2 ft.
Sketch a graph showing the height of the waves from midnight to 6 pm. (Let x be the time in hours since midnight.)
Solution
We can go about drawing our sketch by identifying A, B, C, and D. Because of the way the problem is presented, it’s easiest to find the period and the value of B first.
The time from high tide at midnight to high tide at noon is 12 hours, so the period is 12 hours. To find B, we divide: B=2π/12 = π/6.
To find D, which is the midline, we can average the maximum and minimum values: (10+2)/2 = 12/2 =6.
So, the midline is y=6.
The amplitude A is the distance between a maximum value and the midline: 10-6= 4 ft.
The phase shift is 0. Because we’re starting at a maximum value, we can write a cosine function with no phase shift. So C = 0.
Putting it all together, we obtain the function: y=4cos((π/6)(x)) + 6.
Here is the sketch.
In addition to tides, other examples of real world problems that involve sinusoidal waves are a passenger’s height on a Ferris Wheel as a function of time, the distance from the floor that a pendulum traces out, certain populations of animals, and radio waves.
The next time you go to the beach or an amusement park, try to find sinusoidal waves!
You can learn about inverse trigonometric functions here.
I hope you found this article helpful. If so, please share it with someone who can use the information.

Don’t forget to subscribe to our YouTube channel & get updates on new math videos!
About the author:
Jean-Marie Gard is an independent math teacher and tutor based in Massachusetts. You can get in touch with Jean-Marie at https://testpreptoday.com/.